|
OSA-UCS
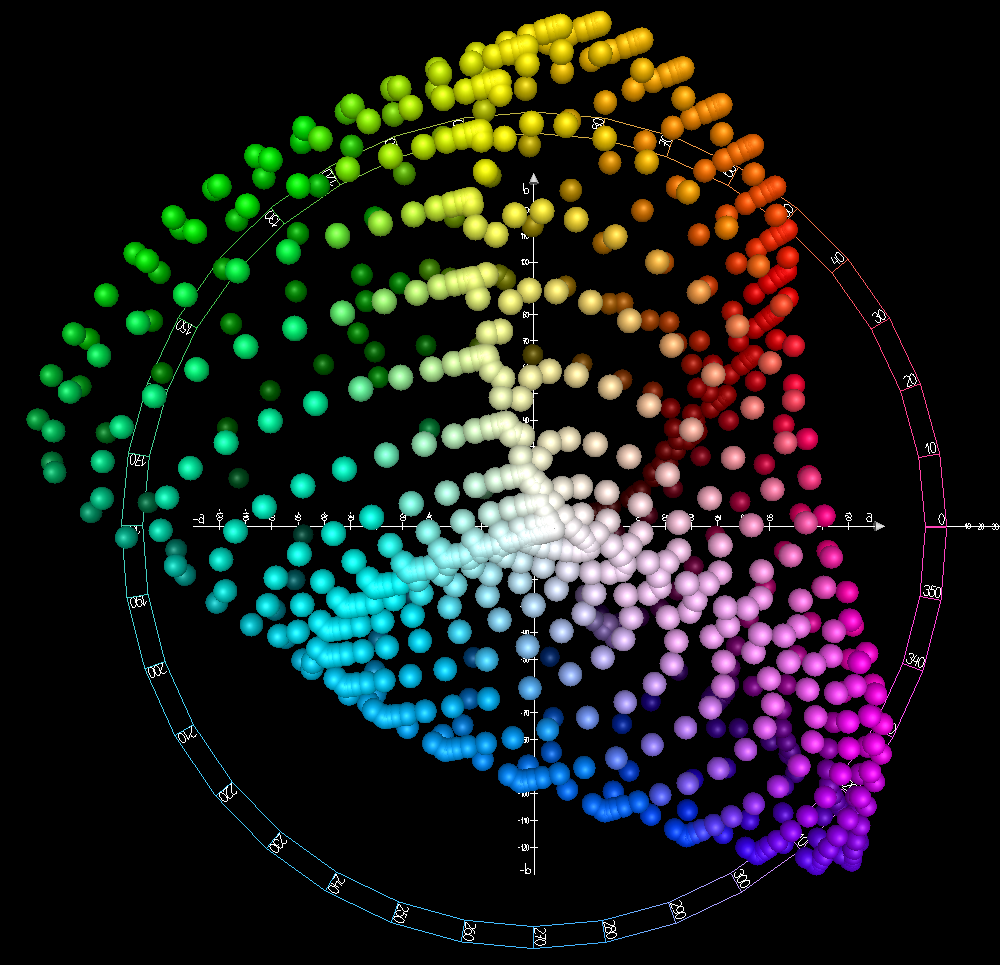
In colorimetry the OSA-UCS (Optical Society of America Uniform Color Space) is a color space first published in 1947 and developed by the Optical Society of America’s Committee on Uniform Color Scales. Previously created color order systems, such as the Munsell color system, failed to represent perceptual uniformity in all directions. The committee decided that, in order to accurately represent uniform color differences in each direction, a new shape of three dimensional Cartesian geometry would need to be used. History and development The development of the OSA-UCS took place during many years, from 1947-1977. Not long after the first mathematical color model was developed by the CIE, David MacAdam showed that when selecting a color on the CIE chromaticity diagram, it could not be guaranteed that colors of the same perceived color difference around this color were at the same color distance with respect to the reference color. More simply, the Euclidean distance between an ... [...More Info...] [...Related Items...] OR: [Wikipedia] [Google] [Baidu] |
Colorimetry
Colorimetry is "the science and technology used to quantify and describe physically the human color perception". It is similar to spectrophotometry, but is distinguished by its interest in reducing spectra to the physical correlates of color perception, most often the CIE 1931 XYZ color space tristimulus values and related quantities. History The Duboscq colorimeter was invented by Jules Duboscq in 1870. Instruments Colorimetric equipment is similar to that used in spectrophotometry. Some related equipment is also mentioned for completeness. * A tristimulus colorimeter measures the tristimulus values of a color. * A spectroradiometer measures the absolute spectral radiance (intensity) or irradiance of a light source. * A spectrophotometer measures the spectral reflectance, transmittance, or relative irradiance of a color sample. * A ''spectrocolorimeter'' is a spectrophotometer that can ''calculate'' tristimulus values. * A densitometer measures the degree of light ... [...More Info...] [...Related Items...] OR: [Wikipedia] [Google] [Baidu] |
Opponent Process
The opponent process is a color theory that states that the human visual system interprets information about color by processing signals from photoreceptor cells in an antagonistic manner. The opponent-process theory suggests that there are three opponent channels, each comprising an opposing color pair: red versus green, blue versus yellow, and black versus white (luminance). The theory was first proposed in 1892 by the German physiologist Ewald Hering. Color theory Complementary colors When staring at a bright color for awhile (e.g. red), then looking away at a white field, an afterimage is perceived, such that the original color will evoke its complementary color (green, in the case of red input). When complementary colors are combined or mixed, they "cancel each other out" and become neutral (white or gray). That is, complementary colors are never perceived as a mixture; there is no "greenish red" or "yellowish blue", despite claims to the contrary. The strongest color con ... [...More Info...] [...Related Items...] OR: [Wikipedia] [Google] [Baidu] |
CIELAB
The CIELAB color space, also referred to as ''L*a*b*'' , is a color space defined by the International Commission on Illumination (abbreviated CIE) in 1976. (Referring to CIELAB as "Lab" without asterisks should be avoided to prevent confusion with Hunter Lab). It expresses color as three values: ''L*'' for perceptual lightness and ''a*'' and ''b*'' for the four unique colors of human vision: red, green, blue and yellow. CIELAB was intended as a perceptually uniform space, where a given numerical change corresponds to a similar perceived change in color. While the LAB space is not truly perceptually uniform, it nevertheless is useful in industry for detecting small differences in color. Like the CIEXYZ space it derives from, CIELAB color space is a device-independent, "standard observer" model. The colors it defines are not relative to any particular device such as a computer monitor or a printer, but instead relate to the CIE standard observer which is an averaging of the ... [...More Info...] [...Related Items...] OR: [Wikipedia] [Google] [Baidu] |
The Optical Society
Optica (formerly known as The Optical Society (OSA) and before that as the Optical Society of America) is a professional society of individuals and companies with an interest in optics and photonics. It publishes journals and organizes conferences and exhibitions. It currently has about 488,000 customers in 183 countries, including nearly 300 companies. History Optica was founded in 1916 as the "Optical Society of America", under the leadership of Perley G. Nutting, with 30 optical scientists and instrument makers based in Rochester, New York. It soon published its first journal of research results and established an annual meeting. The first local section was established in Rochester, New York, in 1916 and the ''Journal of the Optical Society of America'' was created in 1918. The first series of joint meetings with the American Physical Society was in 1918. In 2008 it changed its name to The Optical Society (OSA). In September 2021, the organization's name changed to Optica, ... [...More Info...] [...Related Items...] OR: [Wikipedia] [Google] [Baidu] |
Color Model
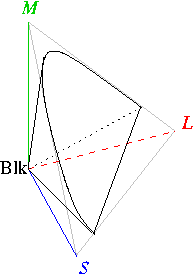
A color model is an abstract mathematical model describing the way colors can be represented as tuples of numbers, typically as three or four values or color components. When this model is associated with a precise description of how the components are to be interpreted (viewing conditions, etc.), taking account of visual perception, the resulting set of colors is called "color space." This article describes ways in which human color vision can be modeled, and discusses some of the models in common use. Tristimulus color space One can picture this space as a region in three-dimensional Euclidean space if one identifies the ''x'', ''y'', and ''z'' axes with the stimuli for the long-wavelength (''L''), medium-wavelength (''M''), and short-wavelength (''S'') light receptors. The origin, (''S'',''M'',''L'') = (0,0,0), corresponds to black. White has no definite position in this diagram; rather it is defined according to the color temperature or white balance as desired or ... [...More Info...] [...Related Items...] OR: [Wikipedia] [Google] [Baidu] |
Artificial Neural Network
Artificial neural networks (ANNs), usually simply called neural networks (NNs) or neural nets, are computing systems inspired by the biological neural networks that constitute animal brains. An ANN is based on a collection of connected units or nodes called artificial neurons, which loosely model the neurons in a biological brain. Each connection, like the synapses in a biological brain, can transmit a signal to other neurons. An artificial neuron receives signals then processes them and can signal neurons connected to it. The "signal" at a connection is a real number, and the output of each neuron is computed by some non-linear function of the sum of its inputs. The connections are called ''edges''. Neurons and edges typically have a ''weight'' that adjusts as learning proceeds. The weight increases or decreases the strength of the signal at a connection. Neurons may have a threshold such that a signal is sent only if the aggregate signal crosses that threshold. Typically ... [...More Info...] [...Related Items...] OR: [Wikipedia] [Google] [Baidu] |
Newton–Raphson Method
In numerical analysis, Newton's method, also known as the Newton–Raphson method, named after Isaac Newton and Joseph Raphson, is a root-finding algorithm which produces successively better approximations to the roots (or zeroes) of a real-valued function. The most basic version starts with a single-variable function defined for a real variable , the function's derivative , and an initial guess for a root of . If the function satisfies sufficient assumptions and the initial guess is close, then :x_ = x_0 - \frac is a better approximation of the root than . Geometrically, is the intersection of the -axis and the tangent of the graph of at : that is, the improved guess is the unique root of the linear approximation at the initial point. The process is repeated as :x_ = x_n - \frac until a sufficiently precise value is reached. This algorithm is first in the class of Householder's methods, succeeded by Halley's method. The method can also be extended to complex functions an ... [...More Info...] [...Related Items...] OR: [Wikipedia] [Google] [Baidu] |
CIEXYZ
The CIE 1931 color spaces are the first defined quantitative links between distributions of wavelengths in the electromagnetic visible spectrum, and physiologically perceived colors in human color vision. The mathematical relationships that define these color spaces are essential tools for color management, important when dealing with color inks, illuminated displays, and recording devices such as digital cameras. The system was designed in 1931 by the ''"Commission Internationale de l'éclairage"'', known in English as the International Commission on Illumination. The CIE 1931 RGB color space and CIE 1931 XYZ color space were created by the International Commission on Illumination (CIE) in 1931. They resulted from a series of experiments done in the late 1920s by William David Wright using ten observers and John Guild using seven observers. The experimental results were combined into the specification of the CIE RGB color space, from which the CIE XYZ color space was derived. T ... [...More Info...] [...Related Items...] OR: [Wikipedia] [Google] [Baidu] |
Colorfulness
Colorfulness, chroma and saturation are attributes of perceived color relating to chromatic intensity. As defined formally by the International Commission on Illumination (CIE) they respectively describe three different aspects of chromatic intensity, but the terms are often used loosely and interchangeably in contexts where these aspects are not clearly distinguished. The precise meanings of the terms vary by what other functions they are dependent on. * Colorfulness is the "attribute of a visual perception according to which the perceived color of an area appears to be more or less chromatic"., page 87. The colorfulness evoked by an object depends not only on its spectral reflectance but also on the strength of the illumination, and increases with the latter unless the brightness is very high ( Hunt effect). * Chroma is the "colorfulness of an area judged as a proportion of the brightness of a similarly illuminated area that appears white or highly transmitting". As a resu ... [...More Info...] [...Related Items...] OR: [Wikipedia] [Google] [Baidu] |
CIE 1931 Color Space
The CIE 1931 color spaces are the first defined quantitative links between distributions of wavelengths in the electromagnetic visible spectrum, and physiologically perceived colors in human color vision. The mathematical relationships that define these color spaces are essential tools for color management, important when dealing with color inks, illuminated displays, and recording devices such as digital cameras. The system was designed in 1931 by the ''"Commission Internationale de l'éclairage"'', known in English as the International Commission on Illumination. The CIE 1931 RGB color space and CIE 1931 XYZ color space were created by the International Commission on Illumination (CIE) in 1931. They resulted from a series of experiments done in the late 1920s by William David Wright using ten observers and John Guild using seven observers. The experimental results were combined into the specification of the CIE RGB color space, from which the CIE XYZ color space was derived. T ... [...More Info...] [...Related Items...] OR: [Wikipedia] [Google] [Baidu] |
Euclidean Distance
In mathematics, the Euclidean distance between two points in Euclidean space is the length of a line segment between the two points. It can be calculated from the Cartesian coordinates of the points using the Pythagorean theorem, therefore occasionally being called the Pythagorean distance. These names come from the ancient Greek mathematicians Euclid and Pythagoras, although Euclid did not represent distances as numbers, and the connection from the Pythagorean theorem to distance calculation was not made until the 18th century. The distance between two objects that are not points is usually defined to be the smallest distance among pairs of points from the two objects. Formulas are known for computing distances between different types of objects, such as the distance from a point to a line. In advanced mathematics, the concept of distance has been generalized to abstract metric spaces, and other distances than Euclidean have been studied. In some applications in statistic ... [...More Info...] [...Related Items...] OR: [Wikipedia] [Google] [Baidu] |


