|
Cobweb Plot
A cobweb plot, or Verhulst diagram is a visual tool used in the dynamical systems field of mathematics to investigate the qualitative behaviour of one-dimensional iterated functions, such as the logistic map. Using a cobweb plot, it is possible to infer the long term status of an initial condition under repeated application of a map. Method For a given iterated function ''f'': R → R, the plot consists of a diagonal (x = y) line and a curve representing y = f(x). To plot the behaviour of a value x_0, apply the following steps. # Find the point on the function curve with an x-coordinate of x_0. This has the coordinates (x_0, f(x_0)). # Plot horizontally across from this point to the diagonal line. This has the coordinates (f(x_0), f(x_0)). # Plot vertically from the point on the diagonal to the function curve. This has the coordinates (f(x_0), f(f(x_0))). # Repeat from step 2 as required. Interpretation On the cobweb plot, a stable fixed point corresponds to an ... [...More Info...] [...Related Items...] OR: [Wikipedia] [Google] [Baidu] |
Dynamical System
In mathematics, a dynamical system is a system in which a Function (mathematics), function describes the time dependence of a Point (geometry), point in an ambient space. Examples include the mathematical models that describe the swinging of a clock pendulum, fluid dynamics, the flow of water in a pipe, the Brownian motion, random motion of particles in the air, and population dynamics, the number of fish each springtime in a lake. The most general definition unifies several concepts in mathematics such as ordinary differential equations and ergodic theory by allowing different choices of the space and how time is measured. Time can be measured by integers, by real number, real or complex numbers or can be a more general algebraic object, losing the memory of its physical origin, and the space may be a manifold or simply a Set (mathematics), set, without the need of a Differentiability, smooth space-time structure defined on it. At any given time, a dynamical system has a State ... [...More Info...] [...Related Items...] OR: [Wikipedia] [Google] [Baidu] |
Mathematics
Mathematics is an area of knowledge that includes the topics of numbers, formulas and related structures, shapes and the spaces in which they are contained, and quantities and their changes. These topics are represented in modern mathematics with the major subdisciplines of number theory, algebra, geometry, and analysis, respectively. There is no general consensus among mathematicians about a common definition for their academic discipline. Most mathematical activity involves the discovery of properties of abstract objects and the use of pure reason to prove them. These objects consist of either abstractions from nature orin modern mathematicsentities that are stipulated to have certain properties, called axioms. A ''proof'' consists of a succession of applications of deductive rules to already established results. These results include previously proved theorems, axioms, andin case of abstraction from naturesome basic properties that are considered true starting points of ... [...More Info...] [...Related Items...] OR: [Wikipedia] [Google] [Baidu] |
Iterated Function
In mathematics, an iterated function is a function (that is, a function from some set to itself) which is obtained by composing another function with itself a certain number of times. The process of repeatedly applying the same function is called iteration. In this process, starting from some initial object, the result of applying a given function is fed again in the function as input, and this process is repeated. For example on the image on the right: :with the circle‑shaped symbol of function composition. Iterated functions are objects of study in computer science, fractals, dynamical systems, mathematics and renormalization group physics. Definition The formal definition of an iterated function on a set ''X'' follows. Let be a set and be a function. Defining as the ''n''-th iterate of (a notation introduced by Hans Heinrich Bürmann and John Frederick William Herschel), where ''n'' is a non-negative integer, by: f^0 ~ \stackrel ~ \operatorname_ ... [...More Info...] [...Related Items...] OR: [Wikipedia] [Google] [Baidu] |
Logistic Map
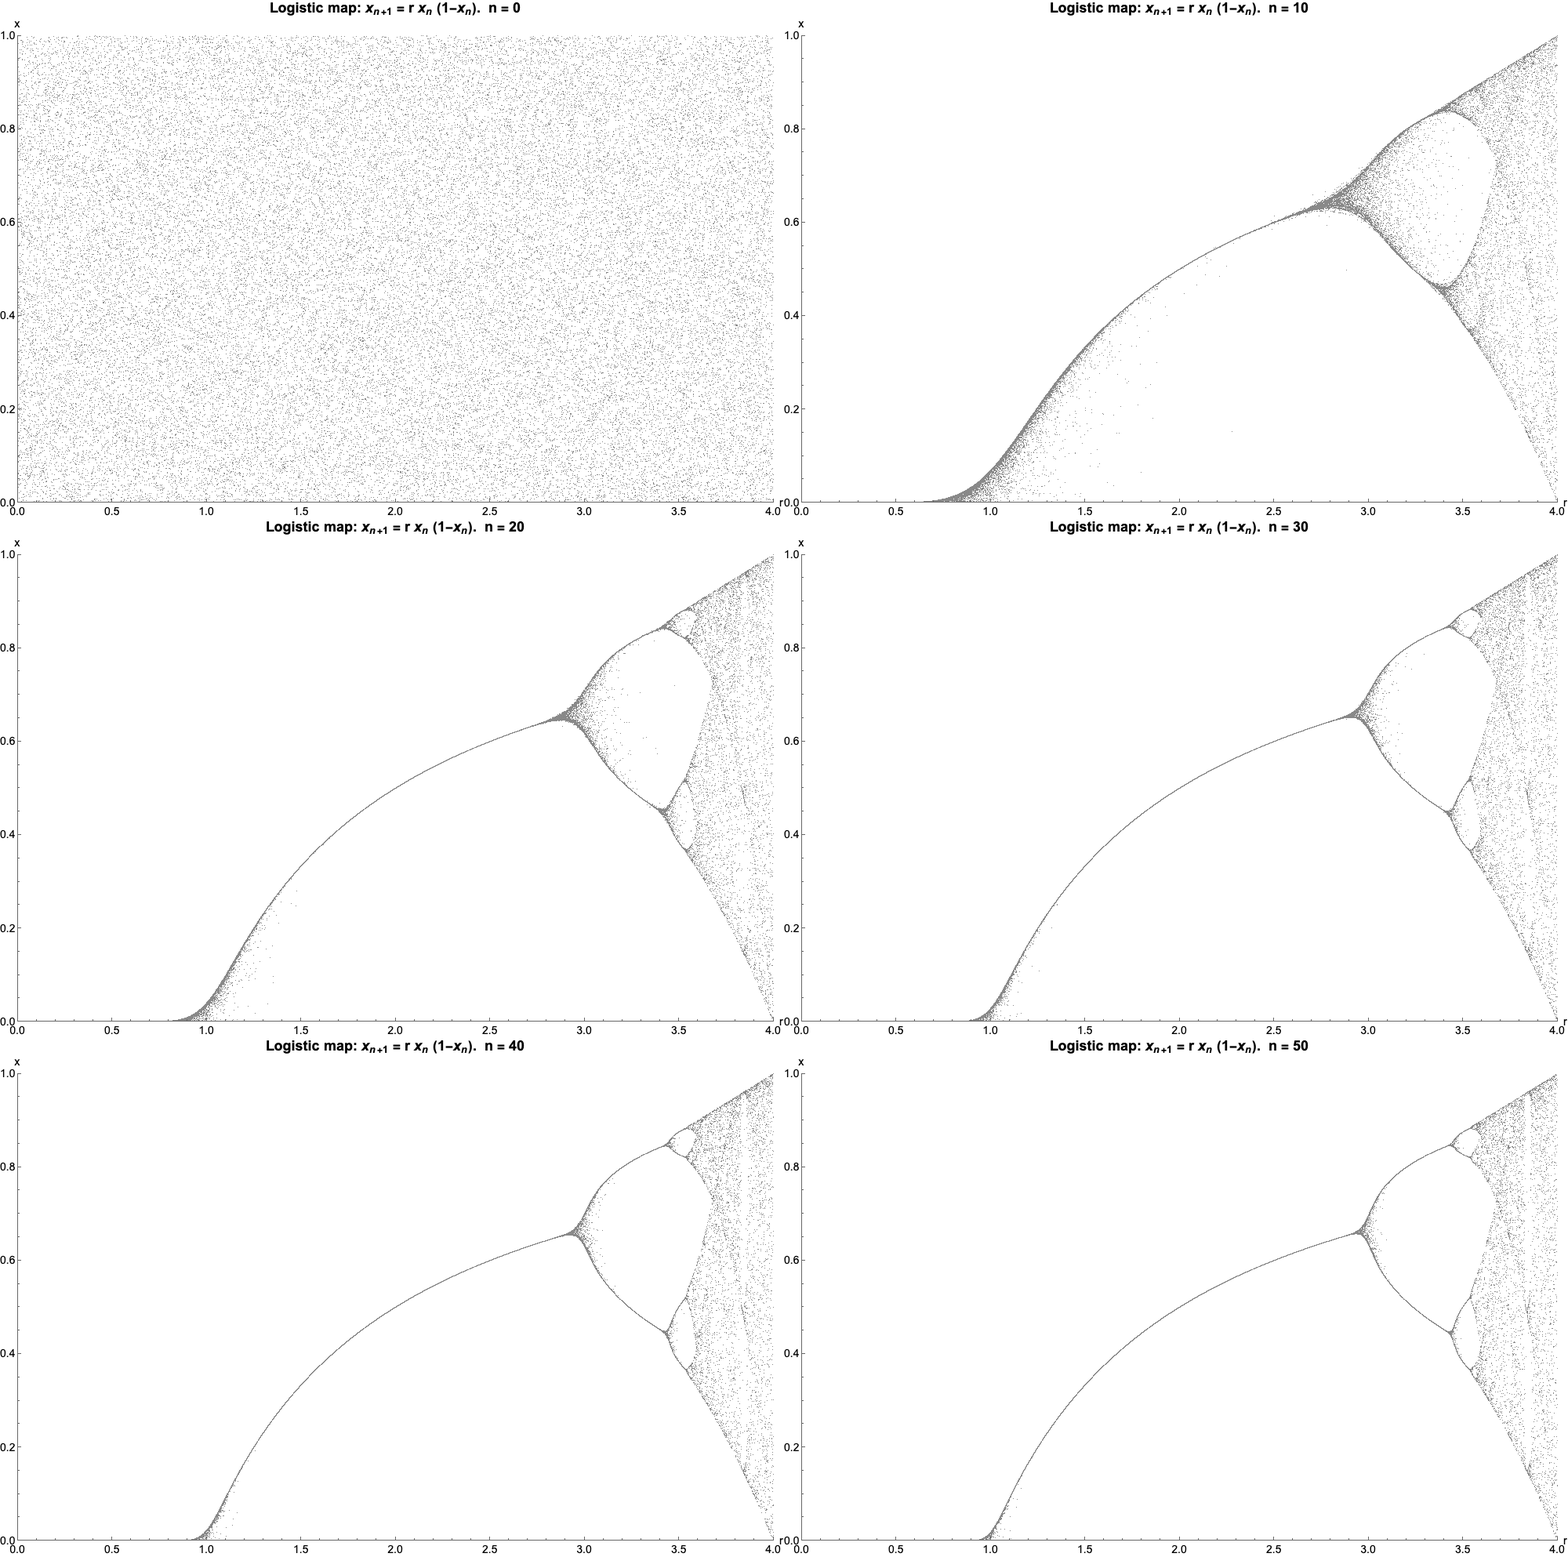
The logistic map is a polynomial mapping (equivalently, recurrence relation) of degree 2, often referred to as an archetypal example of how complex, chaotic behaviour can arise from very simple non-linear dynamical equations. The map was popularized in a 1976 paper by the biologist Robert May, in part as a discrete-time demographic model analogous to the logistic equation written down by Pierre François Verhulst. Mathematically, the logistic map is written where is a number between zero and one, that represents the ratio of existing population to the maximum possible population. This nonlinear difference equation is intended to capture two effects: * ''reproduction'' where the population will increase at a rate proportional to the current population when the population size is small. * ''starvation'' (density-dependent mortality) where the growth rate will decrease at a rate proportional to the value obtained by taking the theoretical "carrying capacity" of the environment l ... [...More Info...] [...Related Items...] OR: [Wikipedia] [Google] [Baidu] |
Initial Condition
In mathematics and particularly in dynamic systems, an initial condition, in some contexts called a seed value, is a value of an evolving variable at some point in time designated as the initial time (typically denoted ''t'' = 0). For a system of order ''k'' (the number of time lags in discrete time, or the order of the largest derivative in continuous time) and dimension ''n'' (that is, with ''n'' different evolving variables, which together can be denoted by an ''n''-dimensional coordinate vector), generally ''nk'' initial conditions are needed in order to trace the system's variables forward through time. In both differential equations in continuous time and difference equations in discrete time, initial conditions affect the value of the dynamic variables (state variables) at any future time. In continuous time, the problem of finding a closed form solution for the state variables as a function of time and of the initial conditions is called the initial value p ... [...More Info...] [...Related Items...] OR: [Wikipedia] [Google] [Baidu] |
Fixed Point (mathematics)
A fixed point (sometimes shortened to fixpoint, also known as an invariant point) is a value that does not change under a given transformation. Specifically, in mathematics, a fixed point of a function is an element that is mapped to itself by the function. In physics, the term fixed point can refer to a temperature that can be used as a reproducible reference point, usually defined by a phase change or triple point. Fixed point of a function Formally, is a fixed point of a function if belongs to both the domain and the codomain of , and . For example, if is defined on the real numbers by f(x) = x^2 - 3 x + 4, then 2 is a fixed point of , because . Not all functions have fixed points: for example, , has no fixed points, since is never equal to for any real number. In graphical terms, a fixed point means the point is on the line , or in other words the graph of has a point in common with that line. Fixed-point iteration In numerical analysis, ''fixed-point iter ... [...More Info...] [...Related Items...] OR: [Wikipedia] [Google] [Baidu] |
Spiral
In mathematics, a spiral is a curve which emanates from a point, moving farther away as it revolves around the point. Helices Two major definitions of "spiral" in the American Heritage Dictionary are:Spiral ''American Heritage Dictionary of the English Language'', Houghton Mifflin Company, Fourth Edition, 2009. # a curve on a plane that winds around a fixed center point at a continuously increasing or decreasing distance from the point. # a three-dimensional curve that turns around an axis at a constant or continuously varying distance while moving parallel to the axis; a . The first definition describes a |
Orbit (dynamics)
In mathematics, specifically in the study of dynamical systems, an orbit is a collection of points related by the evolution function of the dynamical system. It can be understood as the subset of phase space covered by the trajectory of the dynamical system under a particular set of initial conditions, as the system evolves. As a phase space trajectory is uniquely determined for any given set of phase space coordinates, it is not possible for different orbits to intersect in phase space, therefore the set of all orbits of a dynamical system is a partition of the phase space. Understanding the properties of orbits by using topological methods is one of the objectives of the modern theory of dynamical systems. For discrete-time dynamical systems, the orbits are sequences; for real dynamical systems, the orbits are curves; and for holomorphic dynamical systems, the orbits are Riemann surfaces. Definition Given a dynamical system (''T'', ''M'', Φ) with ''T'' a group, ''M'' a s ... [...More Info...] [...Related Items...] OR: [Wikipedia] [Google] [Baidu] |
Chaos Theory
Chaos theory is an interdisciplinary area of scientific study and branch of mathematics focused on underlying patterns and deterministic laws of dynamical systems that are highly sensitive to initial conditions, and were once thought to have completely random states of disorder and irregularities. Chaos theory states that within the apparent randomness of chaotic complex systems, there are underlying patterns, interconnection, constant feedback loops, repetition, self-similarity, fractals, and self-organization. The butterfly effect, an underlying principle of chaos, describes how a small change in one state of a deterministic nonlinear system can result in large differences in a later state (meaning that there is sensitive dependence on initial conditions). A metaphor for this behavior is that a butterfly flapping its wings in Brazil can cause a tornado in Texas. Small differences in initial conditions, such as those due to errors in measurements or due to rounding errors i ... [...More Info...] [...Related Items...] OR: [Wikipedia] [Google] [Baidu] |
Jones Diagram
A Jones diagram is a type of Cartesian graph developed by Loyd A. Jones in the 1940s, where each axis represents a different variable. In a Jones diagram opposite directions of an axis represent different quantities, unlike in a Cartesian graph where they represent positive or negative signs of the same quantity. The Jones diagram therefore represents four variables. Each quadrant shares the vertical axis with its horizontal neighbor, and the horizontal axis with the vertical neighbor. For example, the top left quadrant shares its vertical axis with the top right quadrant, and the horizontal axis with the bottom left quadrant. The overall system response is in quadrant I; the variables that contribute to it are in quadrants II through IV. Jones diagrams in photography A common application of Jones diagrams is in photography, specifically in displaying sensitivity to light with what are also called "tone reproduction diagrams". These diagrams are used in the design of photographi ... [...More Info...] [...Related Items...] OR: [Wikipedia] [Google] [Baidu] |


