|
Two-dimensional Correlation Analysis
Two dimensional correlation analysis is a mathematical technique that is used to study changes in measured signals. As mostly spectroscopic signals are discussed, sometime also two dimensional correlation spectroscopy is used and refers to the same technique. In 2D correlation analysis, a sample is subjected to an external perturbation while all other parameters of the system are kept at the same value. This perturbation can be a systematic and controlled change in temperature, pressure, pH, chemical composition of the system, or even time after a catalyst was added to a chemical mixture. As a result of the controlled change (the ''perturbation''), the system will undergo variations which are measured by a chemical or physical detection method. The measured signals or spectra will show systematic variations that are processed with 2D correlation analysis for interpretation. When one considers spectra that consist of few bands, it is quite obvious to determine which bands are subject ... [...More Info...] [...Related Items...] OR: [Wikipedia] [Google] [Baidu] |
Spectroscopy
Spectroscopy is the field of study that measures and interprets the electromagnetic spectra that result from the interaction between electromagnetic radiation and matter as a function of the wavelength or frequency of the radiation. Matter waves and acoustic waves can also be considered forms of radiative energy, and recently gravitational waves have been associated with a spectral signature in the context of the Laser Interferometer Gravitational-Wave Observatory (LIGO) In simpler terms, spectroscopy is the precise study of color as generalized from visible light to all bands of the electromagnetic spectrum. Historically, spectroscopy originated as the study of the wavelength dependence of the absorption by gas phase matter of visible light dispersed by a prism. Spectroscopy, primarily in the electromagnetic spectrum, is a fundamental exploratory tool in the fields of astronomy, chemistry, materials science, and physics, allowing the composition, physical structure and e ... [...More Info...] [...Related Items...] OR: [Wikipedia] [Google] [Baidu] |
Infrared Spectroscopy
Infrared spectroscopy (IR spectroscopy or vibrational spectroscopy) is the measurement of the interaction of infrared radiation with matter by absorption, emission, or reflection. It is used to study and identify chemical substances or functional groups in solid, liquid, or gaseous forms. It can be used to characterize new materials or identify and verify known and unknown samples. The method or technique of infrared spectroscopy is conducted with an instrument called an infrared spectrometer (or spectrophotometer) which produces an infrared spectrum. An IR spectrum can be visualized in a graph of infrared light absorbance (or transmittance) on the vertical axis vs. frequency, wavenumber or wavelength on the horizontal axis. Typical units of wavenumber used in IR spectra are reciprocal centimeters, with the symbol cm−1. Units of IR wavelength are commonly given in micrometers (formerly called "microns"), symbol μm, which are related to the wavenumber in a reciprocal way. A com ... [...More Info...] [...Related Items...] OR: [Wikipedia] [Google] [Baidu] |
Two-dimensional Infrared Spectroscopy
Two-dimensional infrared spectroscopy (2D IR) is a nonlinear infrared spectroscopy technique that has the ability to correlate vibrational modes in condensed-phase systems. This technique provides information beyond linear infrared spectra, by spreading the vibrational information along multiple axes, yielding a frequency correlation spectrum. A frequency correlation spectrum can offer structural information such as vibrational mode coupling, anharmonicities, along with chemical dynamics such as energy transfer rates and molecular dynamics with femtosecond time resolution. 2DIR experiments have only become possible with the development of ultrafast lasers and the ability to generate femtosecond infrared pulses. Systems studied Among the many systems studied with infrared spectroscopy are water, metal carbonyls, short polypeptides, proteins, perovskite solar cells, and DNA oligomers. Experimental approaches There are two main approaches to two-dimensional spectroscopy, the Fouri ... [...More Info...] [...Related Items...] OR: [Wikipedia] [Google] [Baidu] |
Fluorescence Correlation Spectroscopy
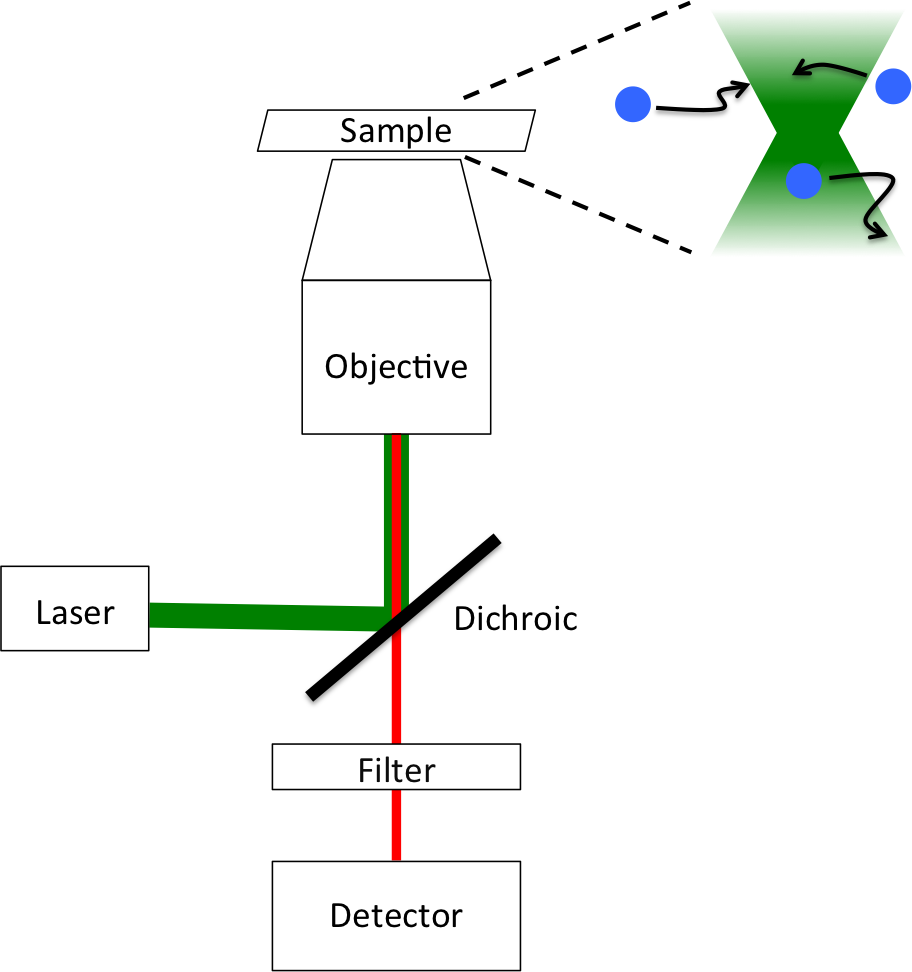
Fluorescence correlation spectroscopy (FCS) is a statistical analysis, via time correlation, of stationary fluctuations of the fluorescence intensity. Its theoretical underpinning originated from L. Onsager's regression hypothesis. The analysis provides kinetic parameters of the physical processes underlying the fluctuations. One of the interesting applications of this is an analysis of the concentration fluctuations of fluorescent particles (molecules) in solution. In this application, the fluorescence emitted from a very tiny space in solution containing a small number of fluorescent particles (molecules) is observed. The fluorescence intensity is fluctuating due to Brownian motion of the particles. In other words, the number of the particles in the sub-space defined by the optical system is randomly changing around the average number. The analysis gives the average number of fluorescent particles and average diffusion time, when the particle is passing through the space. Eventua ... [...More Info...] [...Related Items...] OR: [Wikipedia] [Google] [Baidu] |
Correlation
In statistics, correlation or dependence is any statistical relationship, whether causal or not, between two random variables or bivariate data. Although in the broadest sense, "correlation" may indicate any type of association, in statistics it usually refers to the degree to which a pair of variables are ''linearly'' related. Familiar examples of dependent phenomena include the correlation between the height of parents and their offspring, and the correlation between the price of a good and the quantity the consumers are willing to purchase, as it is depicted in the so-called demand curve. Correlations are useful because they can indicate a predictive relationship that can be exploited in practice. For example, an electrical utility may produce less power on a mild day based on the correlation between electricity demand and weather. In this example, there is a causal relationship, because extreme weather causes people to use more electricity for heating or cooling. However ... [...More Info...] [...Related Items...] OR: [Wikipedia] [Google] [Baidu] |
Covariance
In probability theory and statistics, covariance is a measure of the joint variability of two random variables. If the greater values of one variable mainly correspond with the greater values of the other variable, and the same holds for the lesser values (that is, the variables tend to show similar behavior), the covariance is positive. In the opposite case, when the greater values of one variable mainly correspond to the lesser values of the other, (that is, the variables tend to show opposite behavior), the covariance is negative. The sign of the covariance therefore shows the tendency in the linear relationship between the variables. The magnitude of the covariance is not easy to interpret because it is not normalized and hence depends on the magnitudes of the variables. The normalized version of the covariance, the correlation coefficient, however, shows by its magnitude the strength of the linear relation. A distinction must be made between (1) the covariance of two random ... [...More Info...] [...Related Items...] OR: [Wikipedia] [Google] [Baidu] |
Autocorrelation
Autocorrelation, sometimes known as serial correlation in the discrete time case, is the correlation of a signal with a delayed copy of itself as a function of delay. Informally, it is the similarity between observations of a random variable as a function of the time lag between them. The analysis of autocorrelation is a mathematical tool for finding repeating patterns, such as the presence of a periodic signal obscured by noise, or identifying the missing fundamental frequency in a signal implied by its harmonic frequencies. It is often used in signal processing for analyzing functions or series of values, such as time domain signals. Different fields of study define autocorrelation differently, and not all of these definitions are equivalent. In some fields, the term is used interchangeably with autocovariance. Unit root processes, trend-stationary processes, autoregressive processes, and moving average processes are specific forms of processes with autocorrelation. A ... [...More Info...] [...Related Items...] OR: [Wikipedia] [Google] [Baidu] |
Fluorescence Spectroscopy
Fluorescence spectroscopy (also known as fluorimetry or spectrofluorometry) is a type of electromagnetic spectroscopy that analyzes fluorescence from a sample. It involves using a beam of light, usually ultraviolet light, that excites the electrons in molecules of certain compounds and causes them to emit light; typically, but not necessarily, visible light. A complementary technique is absorption spectroscopy. In the special case of single molecule fluorescence spectroscopy, intensity fluctuations from the emitted light are measured from either single fluorophores, or pairs of fluorophores. Devices that measure fluorescence are called fluorometers. Theory Molecules have various states referred to as energy levels. Fluorescence spectroscopy is primarily concerned with electronic and vibrational states. Generally, the species being examined has a ground electronic state (a low energy state) of interest, and an excited electronic state of higher energy. Within each of these elec ... [...More Info...] [...Related Items...] OR: [Wikipedia] [Google] [Baidu] |


