|
Bland–Altman Plot
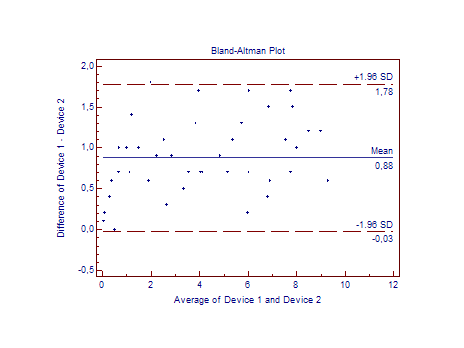
A Bland–Altman plot (difference plot) in analytical chemistry or biomedicine is a method of data plotting used in analyzing the agreement between two different assays. It is identical to a Tukey mean-difference plot, the name by which it is known in other fields, but was popularised in medical statistics by J. Martin Bland and Douglas G. Altman. Agreement versus correlation Bland and Altman drive the point that any two methods that are designed to measure the same parameter (or property) should have good correlation when a set of samples are chosen such that the property to be determined varies considerably. A high correlation for any two methods designed to measure the same property could thus in itself just be a sign that one has chosen a widespread sample. A high correlation does not necessarily imply that there is good agreement between the two methods. Construction Consider a sample consisting of n observations (for example, objects of unknown volume). Both assay ... [...More Info...] [...Related Items...] OR: [Wikipedia] [Google] [Baidu] |
MedCalc
__NOTOC__ MedCalc is a statistical software package designed for the biomedical sciences. It has an integrated spreadsheet for data input and can import files in several formats (Microsoft Excel, Excel, SPSS, Comma-separated values, CSV, ...). MedCalc includes basic parametric and non-parametric statistical procedures and graphs such as descriptive statistics, ANOVA, Mann–Whitney U test, Mann–Whitney test, Wilcoxon signed-rank test, Wilcoxon test, chi-squared distribution, χ2 test, correlation, linear regression, linear as well as Nonlinear regression, non-linear regression, logistic regression, and multivariate statistics. Survival analysis includes Cox regression (Proportional hazards model) and Kaplan–Meier estimator, Kaplan–Meier survival analysis. Procedures for method evaluation and method comparison include ROC curve analysis, Bland–Altman plot, as well as Deming regression, Deming and Passing–Bablok regression. The software also includes reference interval ... [...More Info...] [...Related Items...] OR: [Wikipedia] [Google] [Baidu] |
Analytical Chemistry
Analytical chemistry studies and uses instruments and methods to separate, identify, and quantify matter. In practice, separation, identification or quantification may constitute the entire analysis or be combined with another method. Separation isolates analytes. Qualitative analysis identifies analytes, while quantitative analysis determines the numerical amount or concentration. Analytical chemistry consists of classical, wet chemical methods and modern, instrumental methods. Classical qualitative methods use separations such as precipitation, extraction, and distillation. Identification may be based on differences in color, odor, melting point, boiling point, solubility, radioactivity or reactivity. Classical quantitative analysis uses mass or volume changes to quantify amount. Instrumental methods may be used to separate samples using chromatography, electrophoresis or field flow fractionation. Then qualitative and quantitative analysis can be performed, often with t ... [...More Info...] [...Related Items...] OR: [Wikipedia] [Google] [Baidu] |
Deming Regression
In statistics, Deming regression, named after W. Edwards Deming, is an errors-in-variables model which tries to find the line of best fit for a two-dimensional dataset. It differs from the simple linear regression in that it accounts for errors in observations on both the ''x''- and the ''y''- axis. It is a special case of total least squares, which allows for any number of predictors and a more complicated error structure. Deming regression is equivalent to the maximum likelihood estimation of an errors-in-variables model in which the errors for the two variables are assumed to be independent and normally distributed, and the ratio of their variances, denoted ''δ'', is known. In practice, this ratio might be estimated from related data-sources; however the regression procedure takes no account for possible errors in estimating this ratio. The Deming regression is only slightly more difficult to compute than the simple linear regression. Most statistical software packages used ... [...More Info...] [...Related Items...] OR: [Wikipedia] [Google] [Baidu] |
Estimation Statistics
Estimation statistics, or simply estimation, is a data analysis framework that uses a combination of effect sizes, confidence intervals, precision planning, and meta-analysis to plan experiments, analyze data and interpret results. It complements hypothesis testing approaches such as null hypothesis significance testing (NHST), by going beyond the question is an effect present or not, and provides information about how large an effect is. Estimation statistics is sometimes referred to as ''the new statistics''. The primary aim of estimation methods is to report an effect size (a point estimate) along with its confidence interval, the latter of which is related to the precision of the estimate. The confidence interval summarizes a range of likely values of the underlying population effect. Proponents of estimation see reporting a ''P'' value as an unhelpful distraction from the important business of reporting an effect size with its confidence intervals, and believe that estimat ... [...More Info...] [...Related Items...] OR: [Wikipedia] [Google] [Baidu] |
Limits Of Agreement
In statistics, inter-rater reliability (also called by various similar names, such as inter-rater agreement, inter-rater concordance, inter-observer reliability, inter-coder reliability, and so on) is the degree of agreement among independent observers who rate, code, or assess the same phenomenon. Assessment tools that rely on ratings must exhibit good inter-rater reliability, otherwise they are not valid tests. There are a number of statistics that can be used to determine inter-rater reliability. Different statistics are appropriate for different types of measurement. Some options are joint-probability of agreement, such as Cohen's kappa, Scott's pi and Fleiss' kappa; or inter-rater correlation, concordance correlation coefficient, intra-class correlation, and Krippendorff's alpha. Concept There are several operational definitions of "inter-rater reliability," reflecting different viewpoints about what is a reliable agreement between raters. There are three operational defin ... [...More Info...] [...Related Items...] OR: [Wikipedia] [Google] [Baidu] |
Student's T-test
A ''t''-test is any statistical hypothesis test in which the test statistic follows a Student's ''t''-distribution under the null hypothesis. It is most commonly applied when the test statistic would follow a normal distribution if the value of a Scale parameter, scaling term in the test statistic were known (typically, the scaling term is unknown and therefore a nuisance parameter). When the scaling term is estimated based on the data, the test statistic—under certain conditions—follows a Student's ''t'' distribution. The ''t''-test's most common application is to test whether the means of two populations are different. History The term "''t''-statistic" is abbreviated from "hypothesis test statistic". In statistics, the t-distribution was first derived as a Posterior probability, posterior distribution in 1876 by Friedrich Robert Helmert, Helmert and Jacob Lüroth, Lüroth. The t-distribution also appeared in a more general form as Pearson Type Pearson distribution, IV di ... [...More Info...] [...Related Items...] OR: [Wikipedia] [Google] [Baidu] |
Standard Deviation
In statistics, the standard deviation is a measure of the amount of variation or dispersion of a set of values. A low standard deviation indicates that the values tend to be close to the mean (also called the expected value) of the set, while a high standard deviation indicates that the values are spread out over a wider range. Standard deviation may be abbreviated SD, and is most commonly represented in mathematical texts and equations by the lower case Greek letter σ (sigma), for the population standard deviation, or the Latin letter '' s'', for the sample standard deviation. The standard deviation of a random variable, sample, statistical population, data set, or probability distribution is the square root of its variance. It is algebraically simpler, though in practice less robust, than the average absolute deviation. A useful property of the standard deviation is that, unlike the variance, it is expressed in the same unit as the data. The standard deviation of a popu ... [...More Info...] [...Related Items...] OR: [Wikipedia] [Google] [Baidu] |
Outlier
In statistics, an outlier is a data point that differs significantly from other observations. An outlier may be due to a variability in the measurement, an indication of novel data, or it may be the result of experimental error; the latter are sometimes excluded from the data set. An outlier can be an indication of exciting possibility, but can also cause serious problems in statistical analyses. Outliers can occur by chance in any distribution, but they can indicate novel behaviour or structures in the data-set, measurement error, or that the population has a heavy-tailed distribution. In the case of measurement error, one wishes to discard them or use statistics that are robust to outliers, while in the case of heavy-tailed distributions, they indicate that the distribution has high skewness and that one should be very cautious in using tools or intuitions that assume a normal distribution. A frequent cause of outliers is a mixture of two distributions, which may be two dist ... [...More Info...] [...Related Items...] OR: [Wikipedia] [Google] [Baidu] |
StatsDirect
StatsDirect is a statistical software package designed for biomedical, public health, and general health science uses. The second generation of the software was reviewed in general medical and public health journals. Features and use StatsDirect's interface is menu driven and has editors for spreadsheet-like data and reports. The function library includes common medical statistical methods that can be extended by users via an XML-based description that can embed calls to native StatsDirect numerical libraries, R scripts, or algorithms in any of the .NET languages (such as C#, VB.Net, J#, or F#). Common statistical misconceptions are challenged by the interface. For example, users can perform a chi-square test on a two-by-two table, but they are asked whether the data are from a cohort (perspective) or case-control (retrospective) study before delivering the result. Both processes produce a chi-square test result but more emphasis is put on the appropriate statistic for t ... [...More Info...] [...Related Items...] OR: [Wikipedia] [Google] [Baidu] |
R (programming Language)
R is a programming language for statistical computing and graphics supported by the R Core Team and the R Foundation for Statistical Computing. Created by statisticians Ross Ihaka and Robert Gentleman, R is used among data miners, bioinformaticians and statisticians for data analysis and developing statistical software. Users have created packages to augment the functions of the R language. According to user surveys and studies of scholarly literature databases, R is one of the most commonly used programming languages used in data mining. R ranks 12th in the TIOBE index, a measure of programming language popularity, in which the language peaked in 8th place in August 2020. The official R software environment is an open-source free software environment within the GNU package, available under the GNU General Public License. It is written primarily in C, Fortran, and R itself (partially self-hosting). Precompiled executables are provided for various operating systems. R ... [...More Info...] [...Related Items...] OR: [Wikipedia] [Google] [Baidu] |


