|
Non-uniform Discrete Fourier Transform
In applied mathematics, the nonuniform discrete Fourier transform (NUDFT or NDFT) of a signal is a type of Fourier transform, related to a discrete Fourier transform or discrete-time Fourier transform, but in which the input signal is not sampled at equally spaced points or frequencies (or both). It is a generalization of the shifted DFT. It has important applications in signal processing, magnetic resonance imaging, and the numerical solution of partial differential equations. As a generalized approach for nonuniform sampling, the NUDFT allows one to obtain frequency domain information of a finite length signal at any frequency. One of the reasons to adopt the NUDFT is that many signals have their energy distributed nonuniformly in the frequency domain. Therefore, a nonuniform sampling scheme could be more convenient and useful in many digital signal processing applications. For example, the NUDFT provides a variable spectral resolution controlled by the user. Definition The ' ... [...More Info...] [...Related Items...] OR: [Wikipedia] [Google] [Baidu] |
Fourier Transform
A Fourier transform (FT) is a mathematical transform that decomposes functions into frequency components, which are represented by the output of the transform as a function of frequency. Most commonly functions of time or space are transformed, which will output a function depending on temporal frequency or spatial frequency respectively. That process is also called ''analysis''. An example application would be decomposing the waveform of a musical chord into terms of the intensity of its constituent pitches. The term ''Fourier transform'' refers to both the frequency domain representation and the mathematical operation that associates the frequency domain representation to a function of space or time. The Fourier transform of a function is a complex-valued function representing the complex sinusoids that comprise the original function. For each frequency, the magnitude (absolute value) of the complex value represents the amplitude of a constituent complex sinusoid with that ... [...More Info...] [...Related Items...] OR: [Wikipedia] [Google] [Baidu] |
Semi-Lagrangian Scheme
The Semi-Lagrangian scheme (SLS) is a numerical method that is widely used in numerical weather prediction models for the integration of the equations governing atmospheric motion. A Lagrangian description of a system (such as the atmosphere) focuses on following individual air parcels along their trajectories as opposed to the Eulerian description, which considers the rate of change of system variables fixed at a particular point in space. A semi-Lagrangian scheme uses Eulerian framework but the discrete equations come from the Lagrangian perspective. Some background The Lagrangian rate of change of a quantity F is given by \frac = \frac + (\mathbf\cdot\vec\nabla)F, where F can be a scalar or vector field and \mathbf is the velocity field. The first term on the right-hand side of the above equation is the ''local'' or ''Eulerian'' rate of change of F and the second term is often called the ''advection term''. Note that the Lagrangian rate of change is also known as the material ... [...More Info...] [...Related Items...] OR: [Wikipedia] [Google] [Baidu] |
Fourier Analysis
In mathematics, Fourier analysis () is the study of the way general functions may be represented or approximated by sums of simpler trigonometric functions. Fourier analysis grew from the study of Fourier series, and is named after Joseph Fourier, who showed that representing a function as a sum of trigonometric functions greatly simplifies the study of heat transfer. The subject of Fourier analysis encompasses a vast spectrum of mathematics. In the sciences and engineering, the process of decomposing a function into oscillatory components is often called Fourier analysis, while the operation of rebuilding the function from these pieces is known as Fourier synthesis. For example, determining what component frequencies are present in a musical note would involve computing the Fourier transform of a sampled musical note. One could then re-synthesize the same sound by including the frequency components as revealed in the Fourier analysis. In mathematics, the term ''Fourier ... [...More Info...] [...Related Items...] OR: [Wikipedia] [Google] [Baidu] |
Unevenly Spaced Time Series
In statistics, signal processing, and econometrics, an unevenly (or unequally or irregularly) spaced time series is a sequence of observation time and value pairs (tn, Xn) in which the spacing of observation times is not constant. Unevenly spaced time series naturally occur in many industrial and scientific domains: natural disasters such as earthquakes, floods, or volcanic eruptions typically occur at irregular time intervals. In observational astronomy, measurements such as spectra of celestial objects are taken at times determined by weather conditions, availability of observation time slots, and suitable planetary configurations. In clinical trials (or more generally, longitudinal studies), a patient's state of health may be observed only at irregular time intervals, and different patients are usually observed at different points in time. Wireless sensors in the Internet of things often transmit information only when a state changes to conserve battery life. There are many m ... [...More Info...] [...Related Items...] OR: [Wikipedia] [Google] [Baidu] |
Spectral Estimation
In statistical signal processing, the goal of spectral density estimation (SDE) or simply spectral estimation is to estimate the spectral density (also known as the power spectral density) of a signal from a sequence of time samples of the signal. Intuitively speaking, the spectral density characterizes the frequency content of the signal. One purpose of estimating the spectral density is to detect any periodicities in the data, by observing peaks at the frequencies corresponding to these periodicities. Some SDE techniques assume that a signal is composed of a limited (usually small) number of generating frequencies plus noise and seek to find the location and intensity of the generated frequencies. Others make no assumption on the number of components and seek to estimate the whole generating spectrum. Overview Spectrum analysis, also referred to as frequency domain analysis or spectral density estimation, is the technical process of decomposing a complex signal into ... [...More Info...] [...Related Items...] OR: [Wikipedia] [Google] [Baidu] |
Lomb–Scargle Periodogram
Least-squares spectral analysis (LSSA) is a method of estimating a frequency spectrum, based on a least squares fit of sinusoids to data samples, similar to Fourier analysis. Fourier analysis, the most used spectral method in science, generally boosts long-periodic noise in long gapped records; LSSA mitigates such problems. Unlike with Fourier analysis, data need not be equally spaced to use LSSA. LSSA is also known as the Vaníček method or the Gauss-Vaniček method after Petr Vaníček, and as the Lomb method or the Lomb–Scargle periodogram, based on the contributions of Nicholas R. Lomb and, independently, Jeffrey D. Scargle. Historical background The close connections between Fourier analysis, the periodogram, and least-squares fitting of sinusoids have long been known. Most developments, however, are restricted to complete data sets of equally spaced samples. In 1963, Freek J. M. Barning of Mathematisch Centrum, Amsterdam, handled unequally spaced data by simila ... [...More Info...] [...Related Items...] OR: [Wikipedia] [Google] [Baidu] |
Least-squares Spectral Analysis
Least-squares spectral analysis (LSSA) is a method of estimating a frequency spectrum, based on a least squares fit of sinusoids to data samples, similar to Fourier analysis. Fourier analysis, the most used spectral method in science, generally boosts long-periodic noise in long gapped records; LSSA mitigates such problems. Unlike with Fourier analysis, data need not be equally spaced to use LSSA. LSSA is also known as the Vaníček method or the Gauss-Vaniček method after Petr Vaníček, and as the Lomb method or the Lomb–Scargle periodogram, based on the contributions of Nicholas R. Lomb and, independently, Jeffrey D. Scargle. Historical background The close connections between Fourier analysis, the periodogram, and least-squares fitting of sinusoids have long been known. Most developments, however, are restricted to complete data sets of equally spaced samples. In 1963, Freek J. M. Barning of Mathematisch Centrum, Amsterdam, handled unequally spaced data by similar tec ... [...More Info...] [...Related Items...] OR: [Wikipedia] [Google] [Baidu] |
Fast Fourier Transform
A fast Fourier transform (FFT) is an algorithm that computes the discrete Fourier transform (DFT) of a sequence, or its inverse (IDFT). Fourier analysis converts a signal from its original domain (often time or space) to a representation in the frequency domain and vice versa. The DFT is obtained by decomposing a sequence of values into components of different frequencies. This operation is useful in many fields, but computing it directly from the definition is often too slow to be practical. An FFT rapidly computes such transformations by factorizing the DFT matrix into a product of sparse (mostly zero) factors. As a result, it manages to reduce the complexity of computing the DFT from O\left(N^2\right), which arises if one simply applies the definition of DFT, to O(N \log N), where N is the data size. The difference in speed can be enormous, especially for long data sets where ''N'' may be in the thousands or millions. In the presence of round-off error, many FFT algorithm ... [...More Info...] [...Related Items...] OR: [Wikipedia] [Google] [Baidu] |
Dual-tone Multi-frequency Signaling
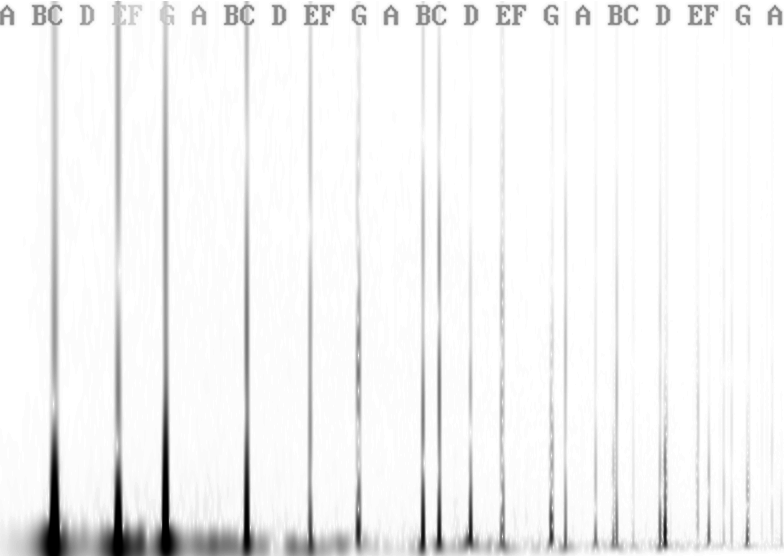
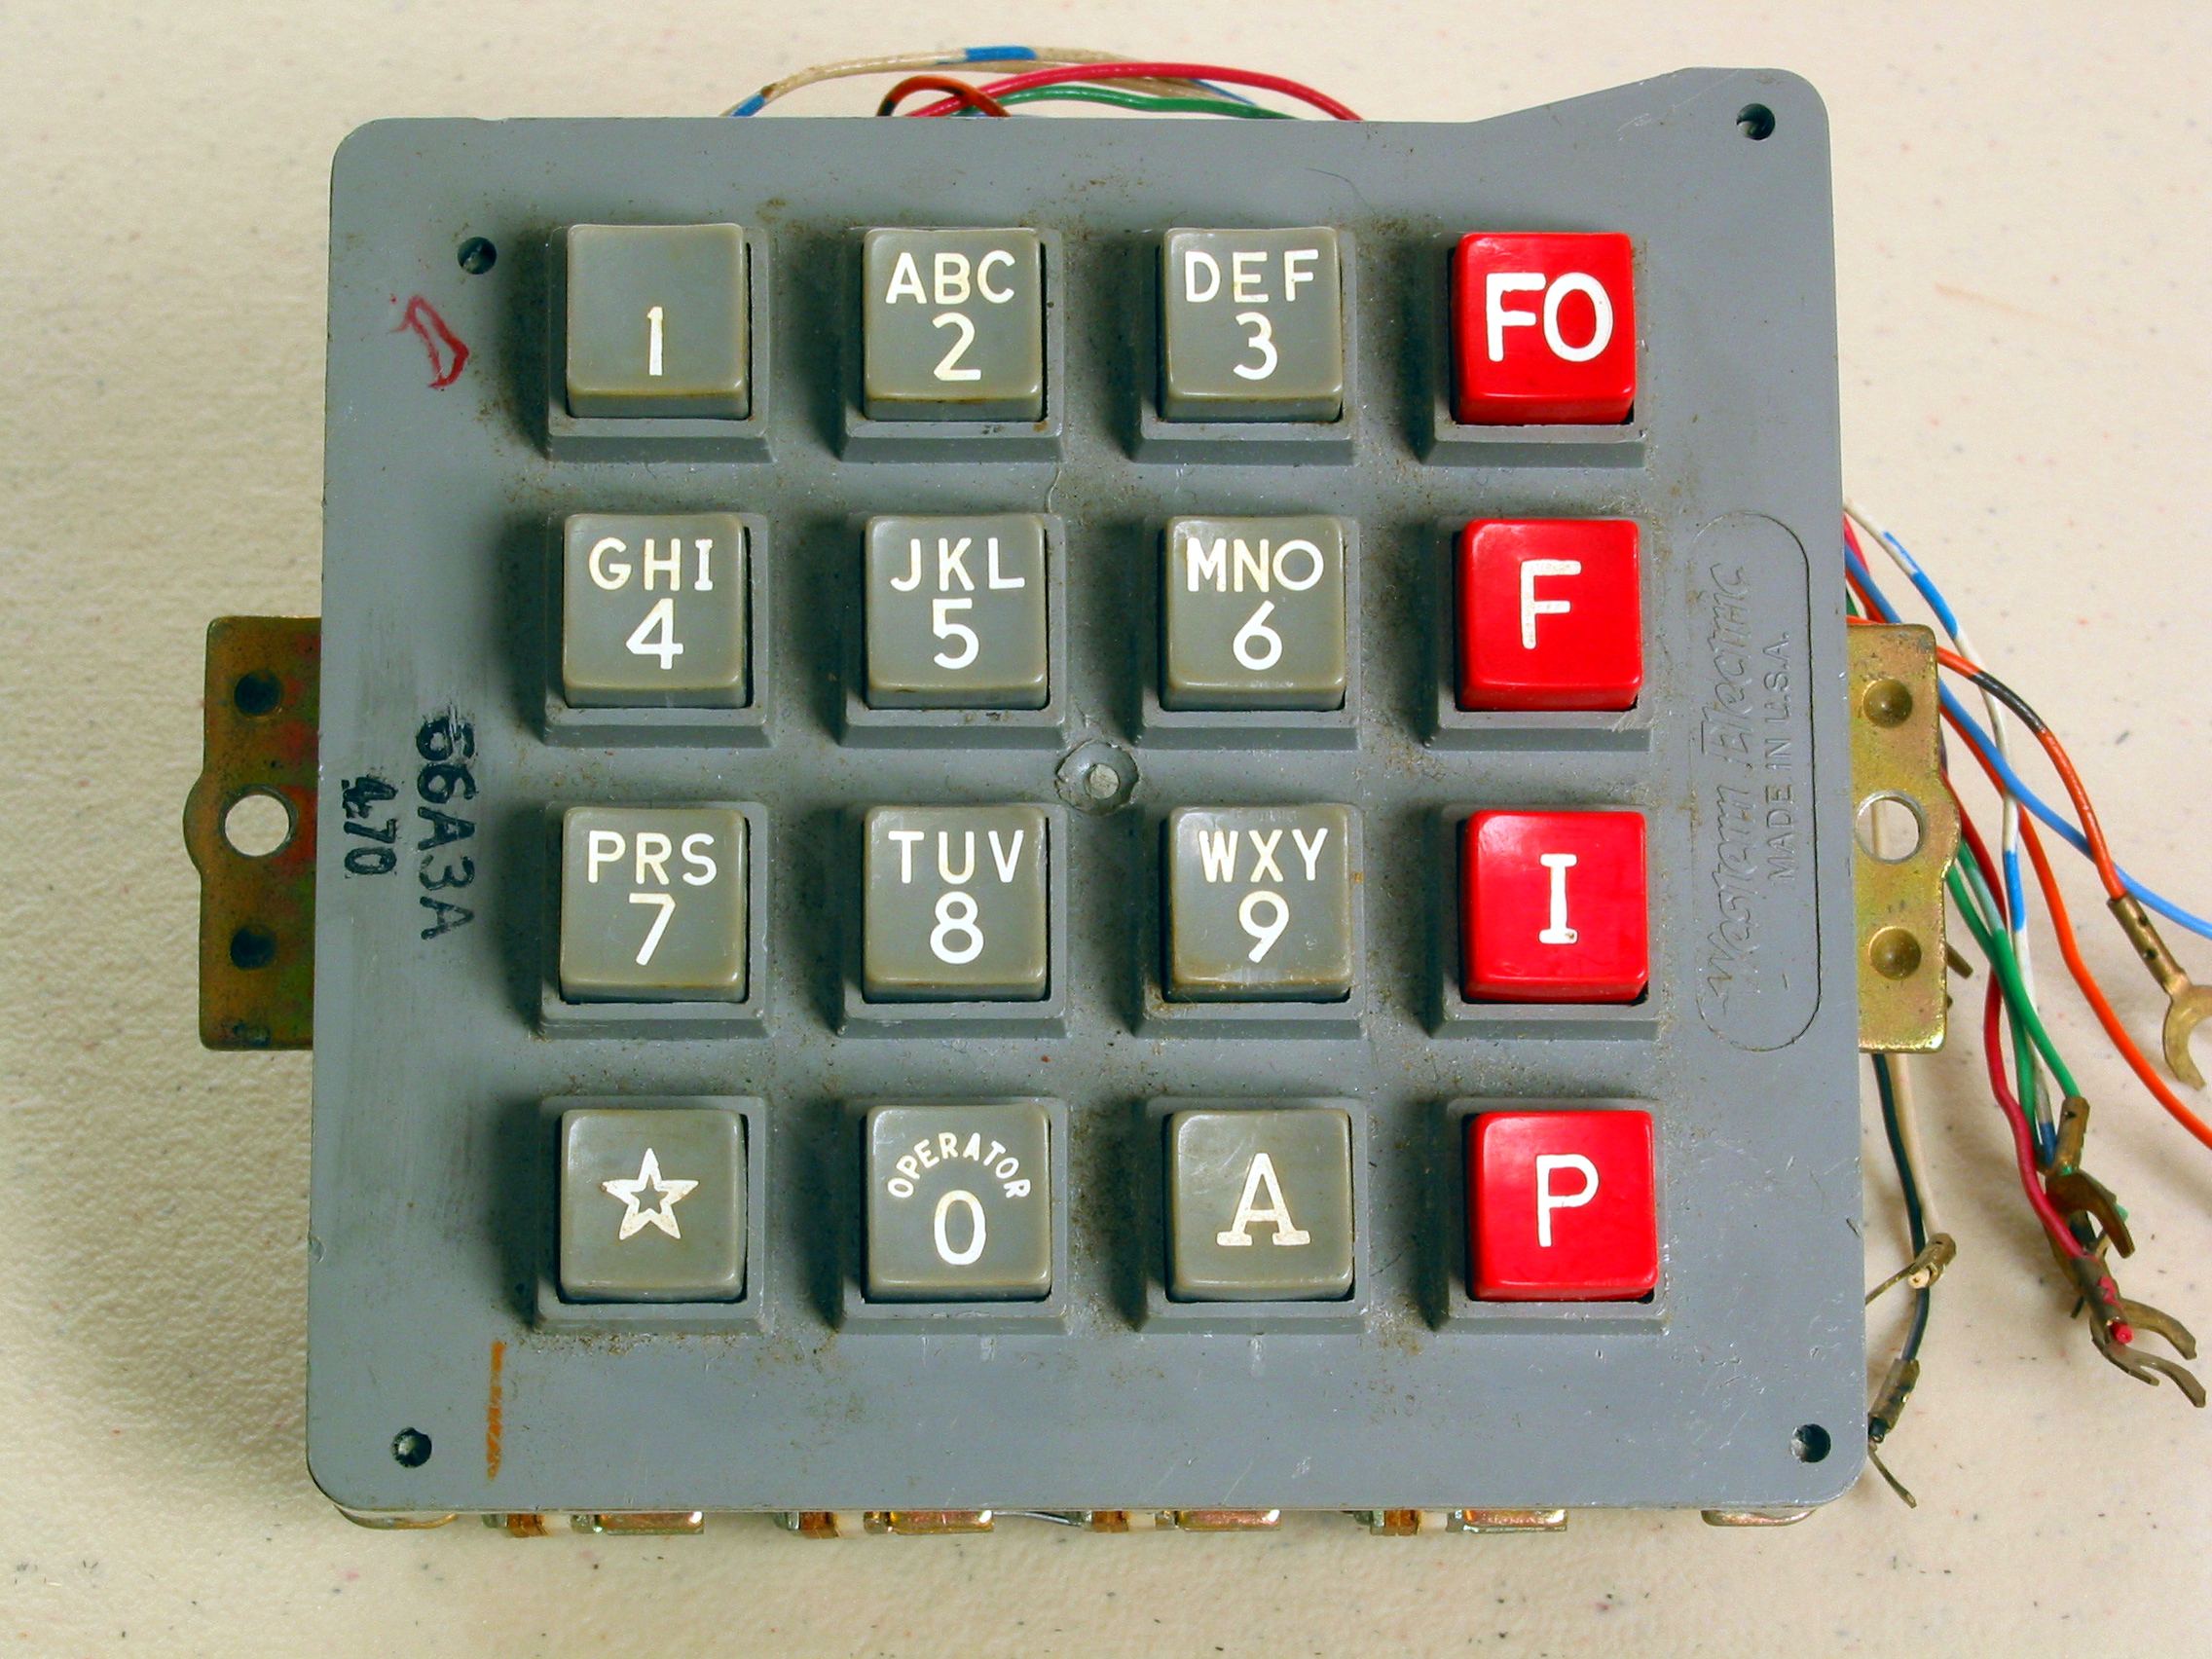
Dual-tone multi-frequency signaling (DTMF) is a telecommunication signaling system using the voice-frequency band over telephone lines between telephone equipment and other communications devices and switching centers. DTMF was first developed in the Bell System in the United States, and became known under the trademark Touch-Tone for use in push-button telephones supplied to telephone customers, starting in 1963. DTMF is standardized as ITU-T Recommendation Q.23. It is also known in the UK as ''MF4''. The Touch-Tone system using a telephone keypad gradually replaced the use of rotary dial and has become the industry standard for landline and mobile service. Other multi-frequency systems are used for internal signaling within the telephone network. Multifrequency signaling Before the development of DTMF, telephone numbers were dialed by users with a loop-disconnect (LD) signaling, more commonly known as pulse dialing (dial pulse, DP) in the United States. It functions by int ... [...More Info...] [...Related Items...] OR: [Wikipedia] [Google] [Baidu] |
Antenna Array
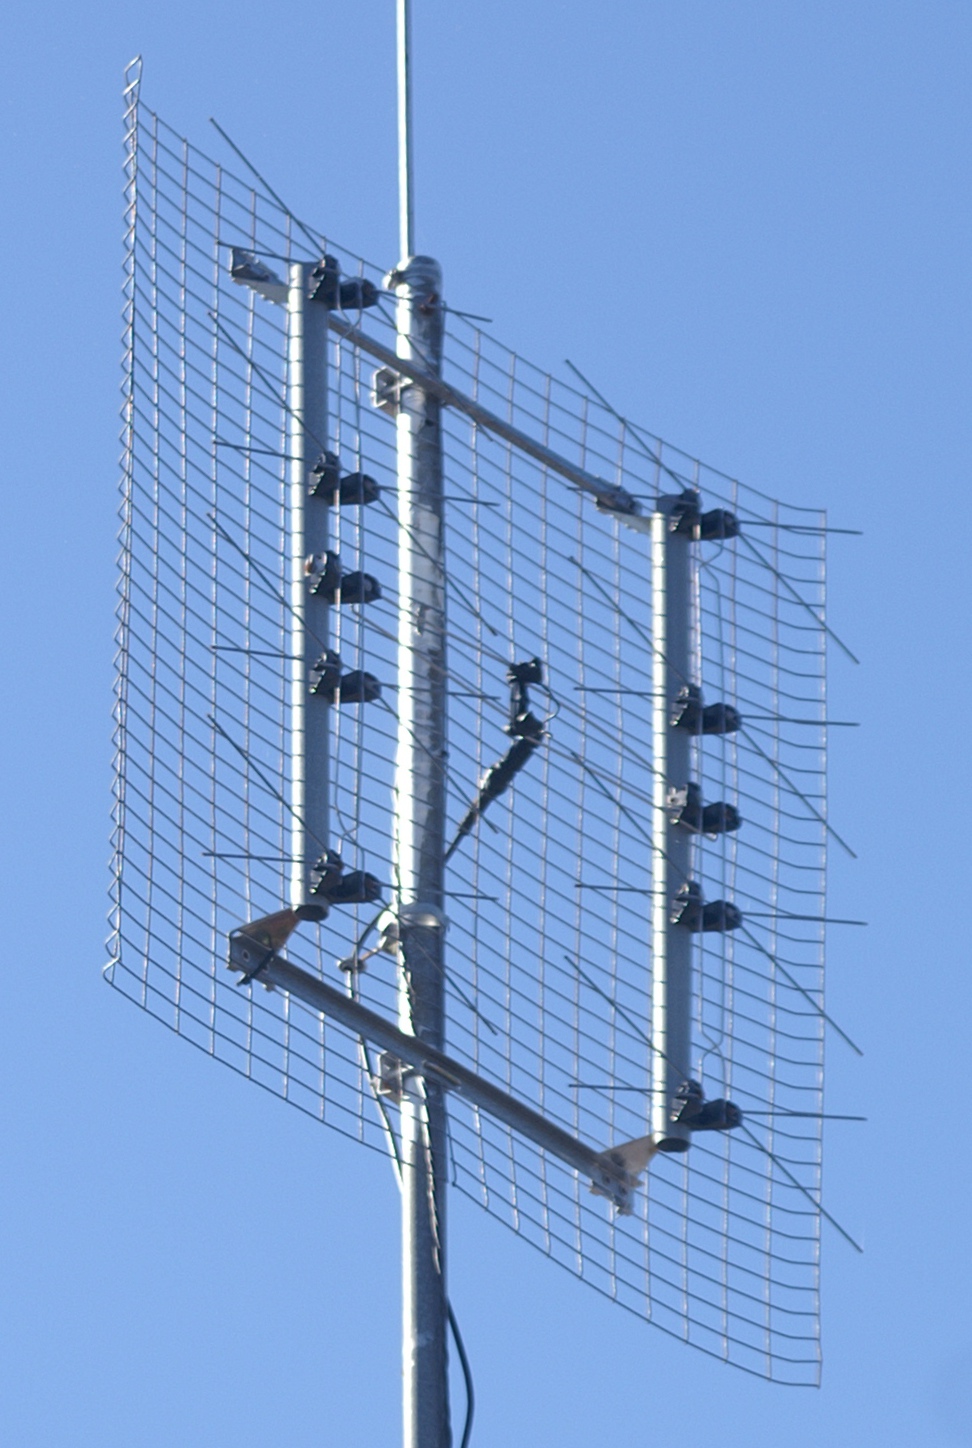
An antenna array (or array antenna) is a set of multiple connected antennas which work together as a single antenna, to transmit or receive radio waves. The individual antennas (called ''elements'') are usually connected to a single receiver or transmitter by feedlines that feed the power to the elements in a specific phase relationship. The radio waves radiated by each individual antenna combine and superpose, adding together ( interfering constructively) to enhance the power radiated in desired directions, and cancelling ( interfering destructively) to reduce the power radiated in other directions. Similarly, when used for receiving, the separate radio frequency currents from the individual antennas combine in the receiver with the correct phase relationship to enhance signals received from the desired directions and cancel signals from undesired directions. More sophisticated array antennas may have multiple transmitter or receiver modules, each connected to a separate a ... [...More Info...] [...Related Items...] OR: [Wikipedia] [Google] [Baidu] |
Digital Filter
In signal processing, a digital filter is a system that performs mathematical operations on a sampled, discrete-time signal to reduce or enhance certain aspects of that signal. This is in contrast to the other major type of electronic filter, the analog filter, which is typically an electronic circuit operating on continuous-time analog signals. A digital filter system usually consists of an analog-to-digital converter (ADC) to sample the input signal, followed by a microprocessor and some peripheral components such as memory to store data and filter coefficients etc. Program Instructions (software) running on the microprocessor implement the digital filter by performing the necessary mathematical operations on the numbers received from the ADC. In some high performance applications, an FPGA or ASIC is used instead of a general purpose microprocessor, or a specialized digital signal processor (DSP) with specific paralleled architecture for expediting operations such as filter ... [...More Info...] [...Related Items...] OR: [Wikipedia] [Google] [Baidu] |
Spectroscopy
Spectroscopy is the field of study that measures and interprets the electromagnetic spectra that result from the interaction between electromagnetic radiation and matter as a function of the wavelength or frequency of the radiation. Matter waves and acoustic waves can also be considered forms of radiative energy, and recently gravitational waves have been associated with a spectral signature in the context of the Laser Interferometer Gravitational-Wave Observatory (LIGO) In simpler terms, spectroscopy is the precise study of color as generalized from visible light to all bands of the electromagnetic spectrum. Historically, spectroscopy originated as the study of the wavelength dependence of the absorption by gas phase matter of visible light dispersed by a prism. Spectroscopy, primarily in the electromagnetic spectrum, is a fundamental exploratory tool in the fields of astronomy, chemistry, materials science, and physics, allowing the composition, physical structure and e ... [...More Info...] [...Related Items...] OR: [Wikipedia] [Google] [Baidu] |

.png)


