|
Money Flow
The money flow index (MFI) is an oscillator that ranges from 0 to 100. It is used to show the ''money flow'' (an approximation of the dollar value of a day's trading) over several days. The steps to calculate the money flow index over N days Step 1: Calculate the typical price The typical price for each day is the average of high price, the low price and the closing price. : typical\ price = Step 2: Calculate the positive and negative money flow The money flow for a certain day is typical price multiplied by volume on that day. : money\ flow = typical\ price \times volume The money flow is divided into positive and negative money flow. * Positive money flow is calculated by adding the money flow of all the days where the typical price is higher than the previous day's typical price. * Negative money flow is calculated by adding the money flow of all the days where the typical price is lower than the previous day's typical price. * If typical price is unchanged then tha ... [...More Info...] [...Related Items...] OR: [Wikipedia] [Google] [Baidu] |
Oscillator (technical Analysis)
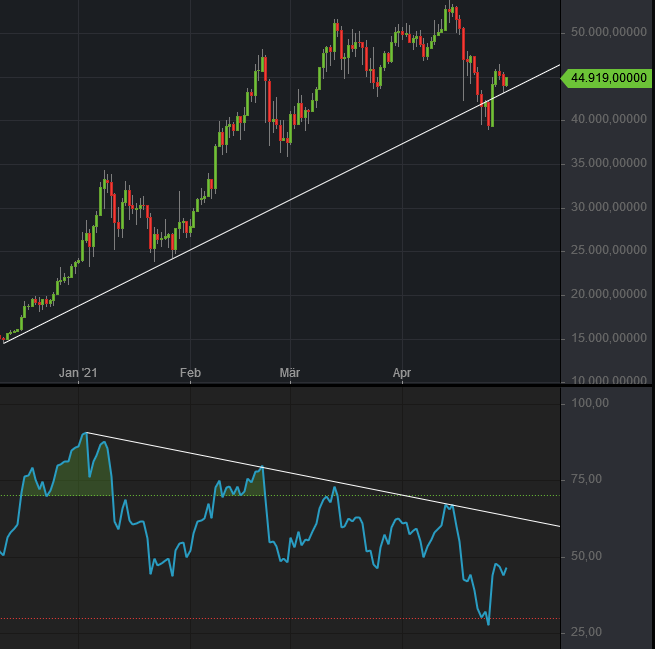
An oscillator is a technical analysis indicator that varies over time within a band (above and below a center line, or between set levels). Oscillators are used to discover short-term overbought or oversold conditions. Common oscillators are MACD, ROC, RSI, CCI. See also * Technical analysis In finance, technical analysis is an analysis methodology for analysing and forecasting the direction of prices through the study of past market data, primarily price and volume. Behavioral economics and quantitative analysis use many of the sam ... ReferencesInvestopedia - Oscillator {{technical analysis [...More Info...] [...Related Items...] OR: [Wikipedia] [Google] [Baidu] |
Typical Price
In financial trading, typical price (sometimes called the pivot point) refers to the arithmetic average of the high, low, and closing prices for a given period. \text = \frac For example, consider a period of one day. If the high for that day was 1.2200, the low was 1.2080, and the closing price was 1.2150, then the typical price for that day would be: TP = (1.2200 + 1.2080 + 1.2150)/3 = 1.2143. Typical Price is mostly used as a component in various technical studies: Pivot Point, Commodity channel index The commodity channel index (CCI) is an oscillator originally introduced by Donald Lambert in 1980. Since its introduction, the indicator has grown in popularity and is now a very common tool for traders in identifying cyclical trends not only in c ... (CCI), Money Flow Index (MFI), Volume Weighted Average (VWAP). in the ... [...More Info...] [...Related Items...] OR: [Wikipedia] [Google] [Baidu] |
Relative Strength Index
The relative strength index (RSI) is a technical indicator used in the analysis of financial markets. It is intended to chart the current and historical strength or weakness of a stock or market based on the closing prices of a recent trading period. The indicator should not be confused with relative strength. The RSI is classified as a momentum oscillator, measuring the velocity and magnitude of price movements. Momentum is the rate of the rise or fall in price. The relative strength RS is given as the ratio of higher closes to lower closes, with closes here meaning averages of absolute values of price changes. The RSI computes momentum as the ratio of higher closes to overall closes: stocks which have had more or stronger positive changes have a higher RSI than stocks which have had more or stronger negative changes. The RSI is most typically used on a 14-day timeframe, measured on a scale from 0 to 100, with high and low levels marked at 70 and 30, respectively. Short or longer ... [...More Info...] [...Related Items...] OR: [Wikipedia] [Google] [Baidu] |
Apple Inc
Apple Inc. is an American multinational technology company headquartered in Cupertino, California, United States. Apple is the largest technology company by revenue (totaling in 2021) and, as of June 2022, is the world's biggest company by market capitalization, the fourth-largest personal computer vendor by unit sales and second-largest mobile phone manufacturer. It is one of the Big Five American information technology companies, alongside Alphabet, Amazon, Meta, and Microsoft. Apple was founded as Apple Computer Company on April 1, 1976, by Steve Wozniak, Steve Jobs and Ronald Wayne to develop and sell Wozniak's Apple I personal computer. It was incorporated by Jobs and Wozniak as Apple Computer, Inc. in 1977 and the company's next computer, the Apple II, became a best seller and one of the first mass-produced microcomputers. Apple went public in 1980 to instant financial success. The company developed computers featuring innovative graphical user inter ... [...More Info...] [...Related Items...] OR: [Wikipedia] [Google] [Baidu] |
ExxonMobil
ExxonMobil Corporation (commonly shortened to Exxon) is an American multinational oil and gas corporation headquartered in Irving, Texas. It is the largest direct descendant of John D. Rockefeller's Standard Oil, and was formed on November 30, 1999, by the merger of Exxon and Mobil, both of which are used as retail brands, alongside Esso, for fueling stations and downstream products today. The company is vertically integrated across the entire oil and gas industry, and within it is also a chemicals division which produces plastic, synthetic rubber, and other chemical products. ExxonMobil is incorporated in New Jersey. ExxonMobil's earliest corporate ancestor was Vacuum Oil Company, though Standard Oil is its largest ancestor prior to its breakup. The entity today known as ExxonMobil grew out of the Standard Oil Company of New Jersey (or Jersey Standard for short), the corporate entity which effectively controlled all of Standard Oil prior to its breakup. Jersey Standard grew a ... [...More Info...] [...Related Items...] OR: [Wikipedia] [Google] [Baidu] |
Microsoft
Microsoft Corporation is an American multinational technology corporation producing computer software, consumer electronics, personal computers, and related services headquartered at the Microsoft Redmond campus located in Redmond, Washington, United States. Its best-known software products are the Windows line of operating systems, the Microsoft Office suite, and the Internet Explorer and Edge web browsers. Its flagship hardware products are the Xbox video game consoles and the Microsoft Surface lineup of touchscreen personal computers. Microsoft ranked No. 21 in the 2020 Fortune 500 rankings of the largest United States corporations by total revenue; it was the world's largest software maker by revenue as of 2019. It is one of the Big Five American information technology companies, alongside Alphabet, Amazon, Apple, and Meta. Microsoft was founded by Bill Gates and Paul Allen on April 4, 1975, to develop and sell BASIC interpreters for the Altair 8800. It rose to do ... [...More Info...] [...Related Items...] OR: [Wikipedia] [Google] [Baidu] |
Buy And Hold
Buy and hold, also called position trading, is an investment strategy whereby an investor buys financial assets or non-financial assets such as real estate, to hold them long term, with the goal of realizing price appreciation, despite volatility. This approach implies confidence that the value of the investments will be higher in the future. Investors must not be affected by recency bias, emotions, and must understand their propensity to risk aversion. Investors must buy financial instruments that they expect to appreciate in the long term. Buy and hold investors do not sell after a decline in value. They do not engage in market timing (i.e. selling a security with the goal of buying it again at a lower price) and do not believe in calendar effects such as Sell in May. Buy and hold is an example of passive management. It has been recommended by Warren Buffett, Jack Bogle, Burton Malkiel, John Templeton, Peter Lynch, and Benjamin Graham since, in the long run, there is a high co ... [...More Info...] [...Related Items...] OR: [Wikipedia] [Google] [Baidu] |
On-balance Volume
On-balance volume (OBV) is a technical analysis indicator intended to relate price and volume in the stock market. OBV is based on a cumulative total volume. The formula : OBV = OBV_ + \left\{ \begin{matrix} volume & \mathrm{if}\ close > close_{prev} \\ 0 & \mathrm{if}\ close = close_{prev} \\ -volume & \mathrm{if}\ close < close_{prev} \end{matrix} \right. Because OBV is a cumulative result, the value of OBV depends upon the starting point of the calculation. Application Total for each day is assigned a positive or negative value depending on prices being higher or lower that day. A higher close results in the volume for that day to get a positive value, while a lower close results in negative value. So, when prices are going up, OBV should be going up too, and when prices make a new rally high, then OBV should ...[...More Info...] [...Related Items...] OR: [Wikipedia] [Google] [Baidu] |
Price And Volume Trend
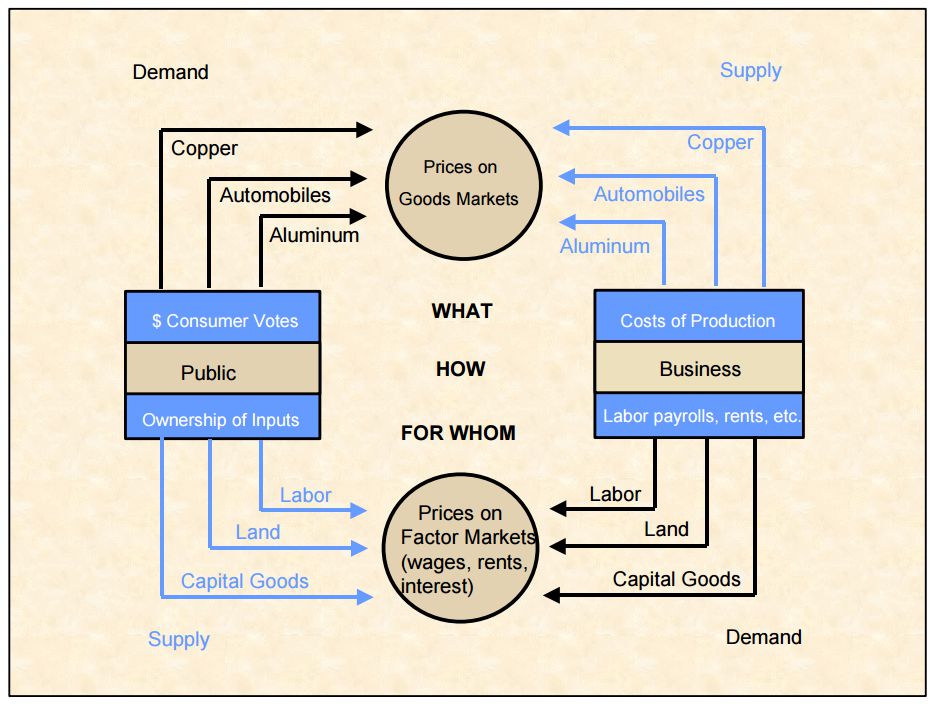
A price is the (usually not negative) quantity of payment or compensation given by one party to another in return for goods or services. In some situations, the price of production has a different name. If the product is a "good" in the commercial exchange, the payment for this product will likely be called its "price". However, if the product is "service", there will be other possible names for this product's name. For example, the graph on the bottom will show some situations A good's price is influenced by production costs, supply of the desired item, and demand for the product. A price may be determined by a monopolist or may be imposed on the firm by market conditions. Price can be quoted to currency, quantities of goods or vouchers. * In modern economies, prices are generally expressed in units of some form of currency. (More specifically, for raw materials they are expressed as currency per unit weight, e.g. euros per kilogram or Rands per KG.) * Although prices ... [...More Info...] [...Related Items...] OR: [Wikipedia] [Google] [Baidu] |
Accumulation/distribution Index
The accumulation/distribution line or accumulation/distribution index in the stock market, is a technical analysis indicator intended to relate price and volume, which supposedly acts as a leading indicator of price movements. Formula : CLV = This ranges from -1 when the close is the low of the day, to +1 when it's the high. For instance if the close is 3/4 the way up the range then CLV is +0.5. The accumulation/distribution index adds up volume multiplied by the CLV factor, i.e. : accdist = accdist_ + volume \times CLV The starting point for the acc/dist total, i.e. the zero point, is arbitrary, only the shape of the resulting indicator is used, not the actual level of the total. The name accumulation/distribution comes from the idea that during accumulation buyers are in control and the price will be bid up through the day, or will make a recovery if sold down, in either case more often finishing near the day's high than the low. The opposite applies during distribution ... [...More Info...] [...Related Items...] OR: [Wikipedia] [Google] [Baidu] |
Stock Market
A stock market, equity market, or share market is the aggregation of buyers and sellers of stocks (also called shares), which represent ownership claims on businesses; these may include ''securities'' listed on a public stock exchange, as well as stock that is only traded privately, such as shares of private companies which are sold to investors through equity crowdfunding platforms. Investment is usually made with an investment strategy in mind. Size of the market The total market capitalization of all publicly traded securities worldwide rose from US$2.5 trillion in 1980 to US$93.7 trillion at the end of 2020. , there are 60 stock exchanges in the world. Of these, there are 16 exchanges with a market capitalization of $1 trillion or more, and they account for 87% of global market capitalization. Apart from the Australian Securities Exchange, these 16 exchanges are all in North America, Europe, or Asia. By country, the largest stock markets as of January 2022 are in th ... [...More Info...] [...Related Items...] OR: [Wikipedia] [Google] [Baidu] |
Technical Analysis
In finance, technical analysis is an analysis methodology for analysing and forecasting the direction of prices through the study of past market data, primarily price and volume. Behavioral economics and quantitative analysis use many of the same tools of technical analysis, which, being an aspect of active management, stands in contradiction to much of modern portfolio theory. The efficacy of both technical and fundamental analysis is disputed by the efficient-market hypothesis, which states that stock market prices are essentially unpredictable, and research on whether technical analysis offers any benefit has produced mixed results. History The principles of technical analysis are derived from hundreds of years of financial market data. Some aspects of technical analysis began to appear in Amsterdam-based merchant Joseph de la Vega's accounts of the Dutch financial markets in the 17th century. In Asia, technical analysis is said to be a method developed by Homma Munehisa duri ... [...More Info...] [...Related Items...] OR: [Wikipedia] [Google] [Baidu] |


