|
Skellam Distribution
The Skellam distribution is the discrete probability distribution of the difference N_1-N_2 of two statistically independent random variables N_1 and N_2, each Poisson-distributed with respective expected values \mu_1 and \mu_2. It is useful in describing the statistics of the difference of two images with simple photon noise, as well as describing the point spread distribution in sports where all scored points are equal, such as baseball, hockey and soccer. The distribution is also applicable to a special case of the difference of dependent Poisson random variables, but just the obvious case where the two variables have a common additive random contribution which is cancelled by the differencing: see Karlis & Ntzoufras (2003) for details and an application. The probability mass function for the Skellam distribution for a difference K=N_1-N_2 between two independent Poisson-distributed random variables with means \mu_1 and \mu_2 is given by: : p(k;\mu_1,\mu_2) = \Pr\ = e^ \ ... [...More Info...] [...Related Items...] OR: [Wikipedia] [Google] [Baidu] |
Moment (mathematics)
In mathematics, the moments of a function are certain quantitative measures related to the shape of the function's graph. If the function represents mass density, then the zeroth moment is the total mass, the first moment (normalized by total mass) is the center of mass, and the second moment is the moment of inertia. If the function is a probability distribution, then the first moment is the expected value, the second central moment is the variance, the third standardized moment is the skewness, and the fourth standardized moment is the kurtosis. The mathematical concept is closely related to the concept of moment in physics. For a distribution of mass or probability on a bounded interval, the collection of all the moments (of all orders, from to ) uniquely determines the distribution (Hausdorff moment problem). The same is not true on unbounded intervals ( Hamburger moment problem). In the mid-nineteenth century, Pafnuty Chebyshev became the first person to think sy ... [...More Info...] [...Related Items...] OR: [Wikipedia] [Google] [Baidu] |
Ratio Distribution
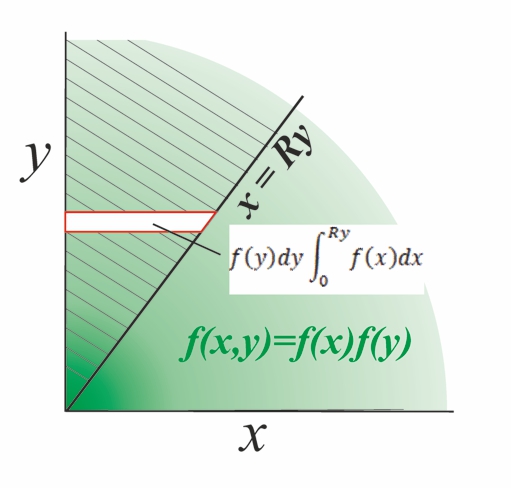
A ratio distribution (also known as a quotient distribution) is a probability distribution constructed as the distribution of the ratio of random variables having two other known distributions. Given two (usually independent) random variables ''X'' and ''Y'', the distribution of the random variable ''Z'' that is formed as the ratio ''Z'' = ''X''/''Y'' is a ''ratio distribution''. An example is the Cauchy distribution (also called the ''normal ratio distribution''), which comes about as the ratio of two normally distributed variables with zero mean. Two other distributions often used in test-statistics are also ratio distributions: the ''t''-distribution arises from a Gaussian random variable divided by an independent chi-distributed random variable, while the ''F''-distribution originates from the ratio of two independent chi-squared distributed random variables. More general ratio distributions have been considered in the literature. Often the ratio distributions are heavy ... [...More Info...] [...Related Items...] OR: [Wikipedia] [Google] [Baidu] |
Journal Of The Royal Statistical Society
The ''Journal of the Royal Statistical Society'' is a peer-reviewed scientific journal of statistics. It comprises three series and is published by Wiley for the Royal Statistical Society. History The Statistical Society of London was founded in 1834, but would not begin producing a journal for four years. From 1834 to 1837, members of the society would read the results of their studies to the other members, and some details were recorded in the proceedings. The first study reported to the society in 1834 was a simple survey of the occupations of people in Manchester, England. Conducted by going door-to-door and inquiring, the study revealed that the most common profession was mill-hands, followed closely by weavers. When founded, the membership of the Statistical Society of London overlapped almost completely with the statistical section of the British Association for the Advancement of Science. In 1837 a volume of ''Transactions of the Statistical Society of London'' were w ... [...More Info...] [...Related Items...] OR: [Wikipedia] [Google] [Baidu] |
Normal Distribution
In statistics, a normal distribution or Gaussian distribution is a type of continuous probability distribution for a real-valued random variable. The general form of its probability density function is : f(x) = \frac e^ The parameter \mu is the mean or expectation of the distribution (and also its median and mode), while the parameter \sigma is its standard deviation. The variance of the distribution is \sigma^2. A random variable with a Gaussian distribution is said to be normally distributed, and is called a normal deviate. Normal distributions are important in statistics and are often used in the natural and social sciences to represent real-valued random variables whose distributions are not known. Their importance is partly due to the central limit theorem. It states that, under some conditions, the average of many samples (observations) of a random variable with finite mean and variance is itself a random variable—whose distribution converges to a normal dist ... [...More Info...] [...Related Items...] OR: [Wikipedia] [Google] [Baidu] |
Big O Notation
Big ''O'' notation is a mathematical notation that describes the limiting behavior of a function when the argument tends towards a particular value or infinity. Big O is a member of a family of notations invented by Paul Bachmann, Edmund Landau, and others, collectively called Bachmann–Landau notation or asymptotic notation. The letter O was chosen by Bachmann to stand for '' Ordnung'', meaning the order of approximation. In computer science, big O notation is used to classify algorithms according to how their run time or space requirements grow as the input size grows. In analytic number theory, big O notation is often used to express a bound on the difference between an arithmetical function and a better understood approximation; a famous example of such a difference is the remainder term in the prime number theorem. Big O notation is also used in many other fields to provide similar estimates. Big O notation characterizes functions according to their growth rates: d ... [...More Info...] [...Related Items...] OR: [Wikipedia] [Google] [Baidu] |
Bessel Function
Bessel functions, first defined by the mathematician Daniel Bernoulli and then generalized by Friedrich Bessel, are canonical solutions of Bessel's differential equation x^2 \frac + x \frac + \left(x^2 - \alpha^2 \right)y = 0 for an arbitrary complex number \alpha, the ''order'' of the Bessel function. Although \alpha and -\alpha produce the same differential equation, it is conventional to define different Bessel functions for these two values in such a way that the Bessel functions are mostly smooth functions of \alpha. The most important cases are when \alpha is an integer or half-integer. Bessel functions for integer \alpha are also known as cylinder functions or the cylindrical harmonics because they appear in the solution to Laplace's equation in cylindrical coordinates. #Spherical Bessel functions, Spherical Bessel functions with half-integer \alpha are obtained when the Helmholtz equation is solved in spherical coordinates. Applications of Bessel functions The Bessel f ... [...More Info...] [...Related Items...] OR: [Wikipedia] [Google] [Baidu] |
Asymptotic Expansion
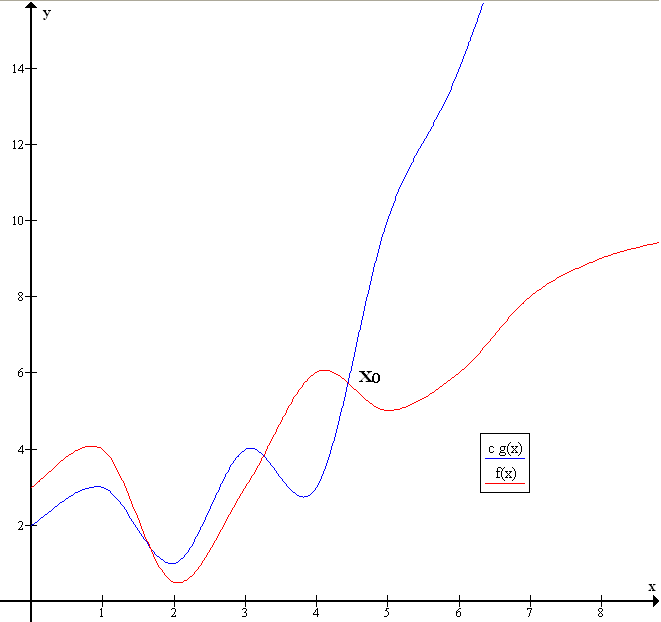
In mathematics, an asymptotic expansion, asymptotic series or Poincaré expansion (after Henri Poincaré) is a formal series of functions which has the property that truncating the series after a finite number of terms provides an approximation to a given function as the argument of the function tends towards a particular, often infinite, point. Investigations by revealed that the divergent part of an asymptotic expansion is latently meaningful, i.e. contains information about the exact value of the expanded function. The most common type of asymptotic expansion is a power series in either positive or negative powers. Methods of generating such expansions include the Euler–Maclaurin summation formula and integral transforms such as the Laplace and Mellin transforms. Repeated integration by parts will often lead to an asymptotic expansion. Since a '' convergent'' Taylor series fits the definition of asymptotic expansion as well, the phrase "asymptotic series" usually implies a ... [...More Info...] [...Related Items...] OR: [Wikipedia] [Google] [Baidu] |
Cumulant
In probability theory and statistics, the cumulants of a probability distribution are a set of quantities that provide an alternative to the '' moments'' of the distribution. Any two probability distributions whose moments are identical will have identical cumulants as well, and vice versa. The first cumulant is the mean, the second cumulant is the variance, and the third cumulant is the same as the third central moment. But fourth and higher-order cumulants are not equal to central moments. In some cases theoretical treatments of problems in terms of cumulants are simpler than those using moments. In particular, when two or more random variables are statistically independent, the -th-order cumulant of their sum is equal to the sum of their -th-order cumulants. As well, the third and higher-order cumulants of a normal distribution are zero, and it is the only distribution with this property. Just as for moments, where ''joint moments'' are used for collections of random variab ... [...More Info...] [...Related Items...] OR: [Wikipedia] [Google] [Baidu] |
Kurtosis
In probability theory and statistics, kurtosis (from el, κυρτός, ''kyrtos'' or ''kurtos'', meaning "curved, arching") is a measure of the "tailedness" of the probability distribution of a real-valued random variable. Like skewness, kurtosis describes a particular aspect of a probability distribution. There are different ways to quantify kurtosis for a theoretical distribution, and there are corresponding ways of estimating it using a sample from a population. Different measures of kurtosis may have different interpretations. The standard measure of a distribution's kurtosis, originating with Karl Pearson, is a scaled version of the fourth moment of the distribution. This number is related to the tails of the distribution, not its peak; hence, the sometimes-seen characterization of kurtosis as " peakedness" is incorrect. For this measure, higher kurtosis corresponds to greater extremity of deviations (or outliers), and not the configuration of data near the mean. I ... [...More Info...] [...Related Items...] OR: [Wikipedia] [Google] [Baidu] |
Skewness
In probability theory and statistics, skewness is a measure of the asymmetry of the probability distribution of a real-valued random variable about its mean. The skewness value can be positive, zero, negative, or undefined. For a unimodal distribution, negative skew commonly indicates that the ''tail'' is on the left side of the distribution, and positive skew indicates that the tail is on the right. In cases where one tail is long but the other tail is fat, skewness does not obey a simple rule. For example, a zero value means that the tails on both sides of the mean balance out overall; this is the case for a symmetric distribution, but can also be true for an asymmetric distribution where one tail is long and thin, and the other is short but fat. Introduction Consider the two distributions in the figure just below. Within each graph, the values on the right side of the distribution taper differently from the values on the left side. These tapering sides are called ' ... [...More Info...] [...Related Items...] OR: [Wikipedia] [Google] [Baidu] |


