|
Sinusoidal Projection
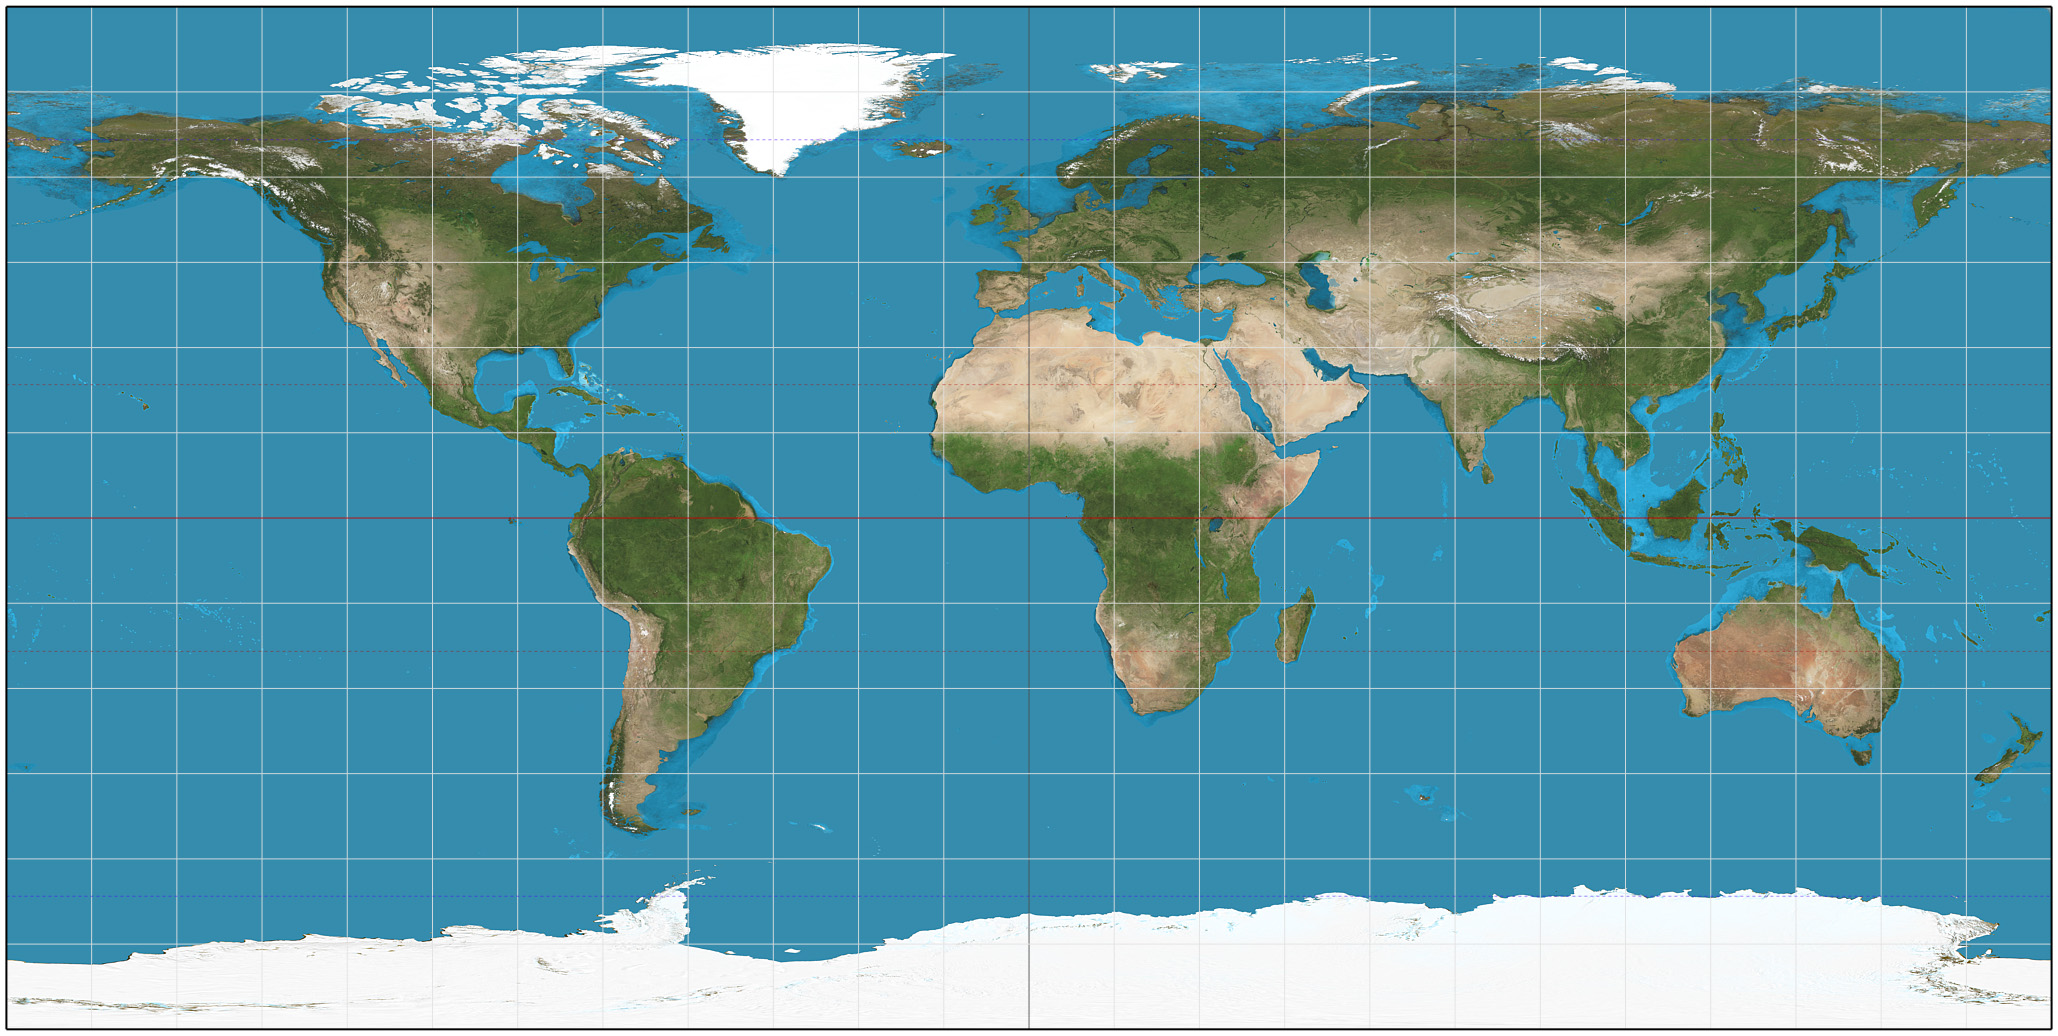
The sinusoidal projection is a pseudocylindrical equal-area map projection, sometimes called the Sanson–Flamsteed or the Mercator equal-area projection. Jean Cossin of Dieppe was one of the first mapmakers to use the sinusoidal, appearing in a world map of 1570. The projection represents the poles as points, as they are on the sphere, but the meridians and continents are distorted. The equator and the prime meridian are the most accurate parts of the map, having no distortion at all, and the further away from those that one examines, the greater the distortion. The projection is defined by: :\begin x &= \left(\lambda - \lambda_0\right) \cos \varphi \\ y &= \varphi\,\end where \varphi is the latitude, ''λ'' is the longitude, and ''λ'' is the longitude of the central meridian. Scale is constant along the central meridian, and east–west scale is constant throughout the map. Therefore, the length of each parallel on the map is proportional to the cosine of the latitude, ... [...More Info...] [...Related Items...] OR: [Wikipedia] [Google] [Baidu] |
Sinusoidal Projection SW
A sine wave, sinusoidal wave, or just sinusoid is a curve, mathematical curve defined in terms of the ''sine'' trigonometric function, of which it is the graph of a function, graph. It is a type of continuous wave and also a Smoothness, smooth periodic function. It occurs often in mathematics, as well as in physics, engineering, signal processing and many other fields. Formulation Its most basic form as a function of time (''t'') is: y(t) = A\sin(2 \pi f t + \varphi) = A\sin(\omega t + \varphi) where: * ''A'', ''amplitude'', the peak deviation of the function from zero. * ''f'', ''frequency, ordinary frequency'', the ''Real number, number'' of oscillations (cycles) that occur each second of time. * ''ω'' = 2''f'', ''angular frequency'', the rate of change of the function argument in units of radians per second. * \varphi, ''phase (waves), phase'', specifies (in radians) where in its cycle the oscillation is at ''t'' = 0. When \varphi is non-zero, the entire waveform appears to ... [...More Info...] [...Related Items...] OR: [Wikipedia] [Google] [Baidu] |
Bonne Projection
The Bonne projection is a pseudoconical equal-area map projection, sometimes called a dépôt de la guerre, modified Flamsteed, or a Sylvanus projection. Although named after Rigobert Bonne (1727–1795), the projection was in use prior to his birth, in 1511 by Sylvanus, Honter in 1561, De l'Isle before 1700 and Coronelli in 1696. Both Sylvanus and Honter's usages were approximate, however, and it is not clear they intended to be the same projection. The Bonne projection maintains accurate shapes of areas along the central meridian and the standard parallel, but progressively distorts away from those regions. Thus, it best maps "t"-shaped regions. It has been used extensively for maps of Europe and Asia. The projection is defined as: :\begin x &= \rho \sin E \\ y &= \cot \varphi_1 - \rho \cos E\end where :\begin\rho &= \cot \varphi_1 + \varphi_1 - \varphi \\ E &= \frac \end and ''φ'' is the latitude, ''λ'' is the longitude, ''λ''0 is the longitude of the central me ... [...More Info...] [...Related Items...] OR: [Wikipedia] [Google] [Baidu] |
John Flamsteed
John Flamsteed (19 August 1646 – 31 December 1719) was an English astronomer and the first Astronomer Royal. His main achievements were the preparation of a 3,000-star catalogue, ''Catalogus Britannicus'', and a star atlas called '' Atlas Coelestis'', both published posthumously. He also made the first recorded observations of Uranus, although he mistakenly catalogued it as a star, and he laid the foundation stone for the Royal Greenwich Observatory. Life Flamsteed was born in Denby, Derbyshire, England, the only son of Stephen Flamsteed and his first wife, Mary Spadman. He was educated at the free school of Derby and at Derby School, in St Peter's Churchyard, Derby, near where his father carried on a malting business. At that time, most masters of the school were Puritans. Flamsteed had a solid knowledge of Latin, essential for reading the scientific literature of the day, and a love of history, leaving the school in May 1662.Birks, John L. (1999) ''John Flamsteed, the ... [...More Info...] [...Related Items...] OR: [Wikipedia] [Google] [Baidu] |
Nicolas Sanson
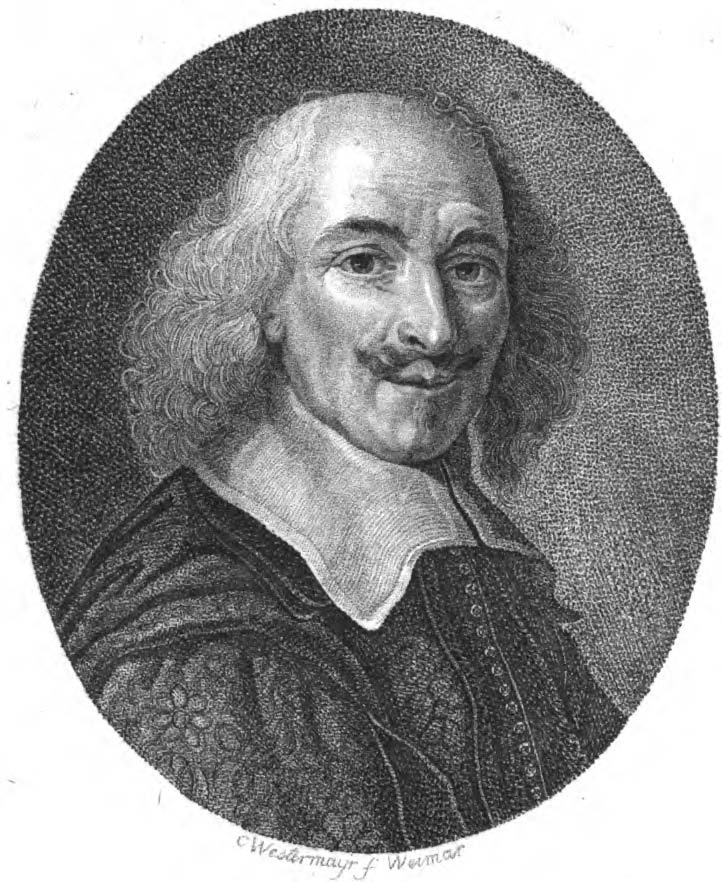
Nicolas Sanson (20 December 1600 – 7 July 1667) was a French cartographer who served under two kings in matters of geography. He has been called the "father of French cartography." Life and work He was born of an old Picard family of Scottish descent, at Abbeville, on 20 (or 31) December 1600, and was educated by the Jesuits at Amiens. In 1627 he attracted the attention of Richelieu by a map of Gaul which he had constructed (or at least begun) while only eighteen. Sanson was royal geographer. He gave lessons in geography both to Louis XIII and to Louis XIV; and when Louis XIII, it is said, came to Abbeville, he preferred to be the guest of Sanson (then employed on the fortifications), instead of occupying the lodgings provided by the town. At the conclusion of this visit the king made Sanson a councillor of state. Active from 1627, Sanson issued his first map of importance, the "Postes de France", which was published by Melchior Tavernier in 1632. After publishing sever ... [...More Info...] [...Related Items...] OR: [Wikipedia] [Google] [Baidu] |
Gerardus Mercator
Gerardus Mercator (; 5 March 1512 – 2 December 1594) was a 16th-century geographer, cosmographer and Cartography, cartographer from the County of Flanders. He is most renowned for creating the Mercator 1569 world map, 1569 world map based on a new Mercator projection, projection which represented sailing courses of constant bearing (rhumb lines) as straight lines—an innovation that is still employed in nautical charts. Mercator was a highly influential pioneer in the history of cartography.Mark Monmonier, Monmonier, Mark: ''Rhumb Lines and Map Wars: A Social History of the Mercator Projection''. (Chicago: University of Chicago Press, 2004)Van der Krogt, Peter (2015), 'Chapter 6: Gerhard Mercator and his Cosmography: How the 'Atlas' became an Atlas,'; in: Gerhard Holzer, et al. (eds.), ''A World of Innovation: Cartography in the Time of Gerhard Mercator''. (Newcastle upon Tyne: Cambridge Scholars Publishing, 2015), pp. 112–130 Along with Gemma Frisius and Abraham Ortelius, ... [...More Info...] [...Related Items...] OR: [Wikipedia] [Google] [Baidu] |
List Of Map Projections
This is a summary of map projections that have articles of their own on Wikipedia or that are otherwise notable. Because there is no limit to the number of possible map projections, there can be no comprehensive list. Table of projections *The first known popularizer/user and not necessarily the creator. Key Type of projection ; Cylindrical: In standard presentation, these map regularly-spaced meridians to equally spaced vertical lines, and parallels to horizontal lines. ; Pseudocylindrical: In standard presentation, these map the central meridian and parallels as straight lines. Other meridians are curves (or possibly straight from pole to equator), regularly spaced along parallels. ; Conic: In standard presentation, conic (or conical) projections map meridians as straight lines, and parallels as arcs of circles. ; Pseudoconical: In standard presentation, pseudoconical projections represent the central meridian as a straight line, other meridians as complex curves, and pa ... [...More Info...] [...Related Items...] OR: [Wikipedia] [Google] [Baidu] |
MODIS
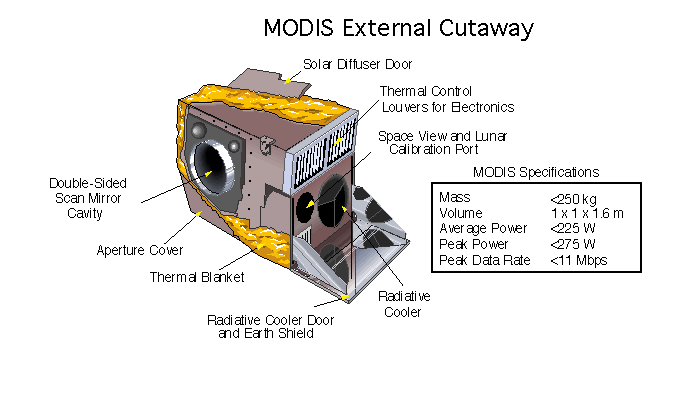
The Moderate Resolution Imaging Spectroradiometer (MODIS) is a satellite-based sensor used for earth and climate measurements. There are two MODIS sensors in Earth orbit: one on board the Terra ( EOS AM) satellite, launched by NASA in 1999; and one on board the Aqua (EOS PM) satellite, launched in 2002. MODIS has now been replaced by the VIIRS, which first launched in 2011 aboard the Suomi NPP satellite. The MODIS instruments were built by Santa Barbara Remote Sensing. They capture data in 36 spectral bands ranging in wavelength from 0.4 μm to 14.4 μm and at varying spatial resolutions (2 bands at 250 m, 5 bands at 500 m and 29 bands at 1 km). Together the instruments image the entire Earth every 1 to 2 days. They are designed to provide measurements in large-scale global dynamics including changes in Earth's cloud cover, radiation budget and processes occurring in the oceans, on land, and in the lower atmosphere. Support and calibration is provided by ... [...More Info...] [...Related Items...] OR: [Wikipedia] [Google] [Baidu] |
Moderate-Resolution Imaging Spectroradiometer
The Moderate Resolution Imaging Spectroradiometer (MODIS) is a satellite-based sensor used for earth and climate measurements. There are two MODIS sensors in Earth orbit: one on board the Terra (EOS AM) satellite, launched by NASA in 1999; and one on board the Aqua (EOS PM) satellite, launched in 2002. MODIS has now been replaced by the VIIRS, which first launched in 2011 aboard the Suomi NPP satellite. The MODIS instruments were built by Santa Barbara Remote Sensing. They capture data in 36 spectral bands ranging in wavelength from 0.4 μm to 14.4 μm and at varying spatial resolutions (2 bands at 250 m, 5 bands at 500 m and 29 bands at 1 km). Together the instruments image the entire Earth every 1 to 2 days. They are designed to provide measurements in large-scale global dynamics including changes in Earth's cloud cover, radiation budget and processes occurring in the oceans, on land, and in the lower atmosphere. Support and calibration is provided by t ... [...More Info...] [...Related Items...] OR: [Wikipedia] [Google] [Baidu] |
Geodesic Grid
A geodesic grid is a spatial grid based on a geodesic polyhedron or Goldberg polyhedron. Construction A geodesic grid is a global Earth reference that uses triangular tiles based on the subdivision of a polyhedron (usually the icosahedron, and usually a Class I subdivision) to subdivide the surface of the Earth. Such a grid does not have a straightforward relationship to latitude and longitude, but conforms to many of the main criteria for a statistically valid discrete global grid. Primarily, the cells' area and shape are generally similar, especially near the poles where many other spatial grids have singularities or heavy distortion. The popular Quaternary Triangular Mesh (QTM) falls into this category. Geodesic grids may use the dual polyhedron of the geodesic polyhedron, which is the Goldberg polyhedron. Goldberg polyhedra are made up of hexagons and (if based on the icosahedron) 12 pentagons. One implementation that uses an icosahedron as the base polyhedron, hexagonal ... [...More Info...] [...Related Items...] OR: [Wikipedia] [Google] [Baidu] |
Bottomley Projection
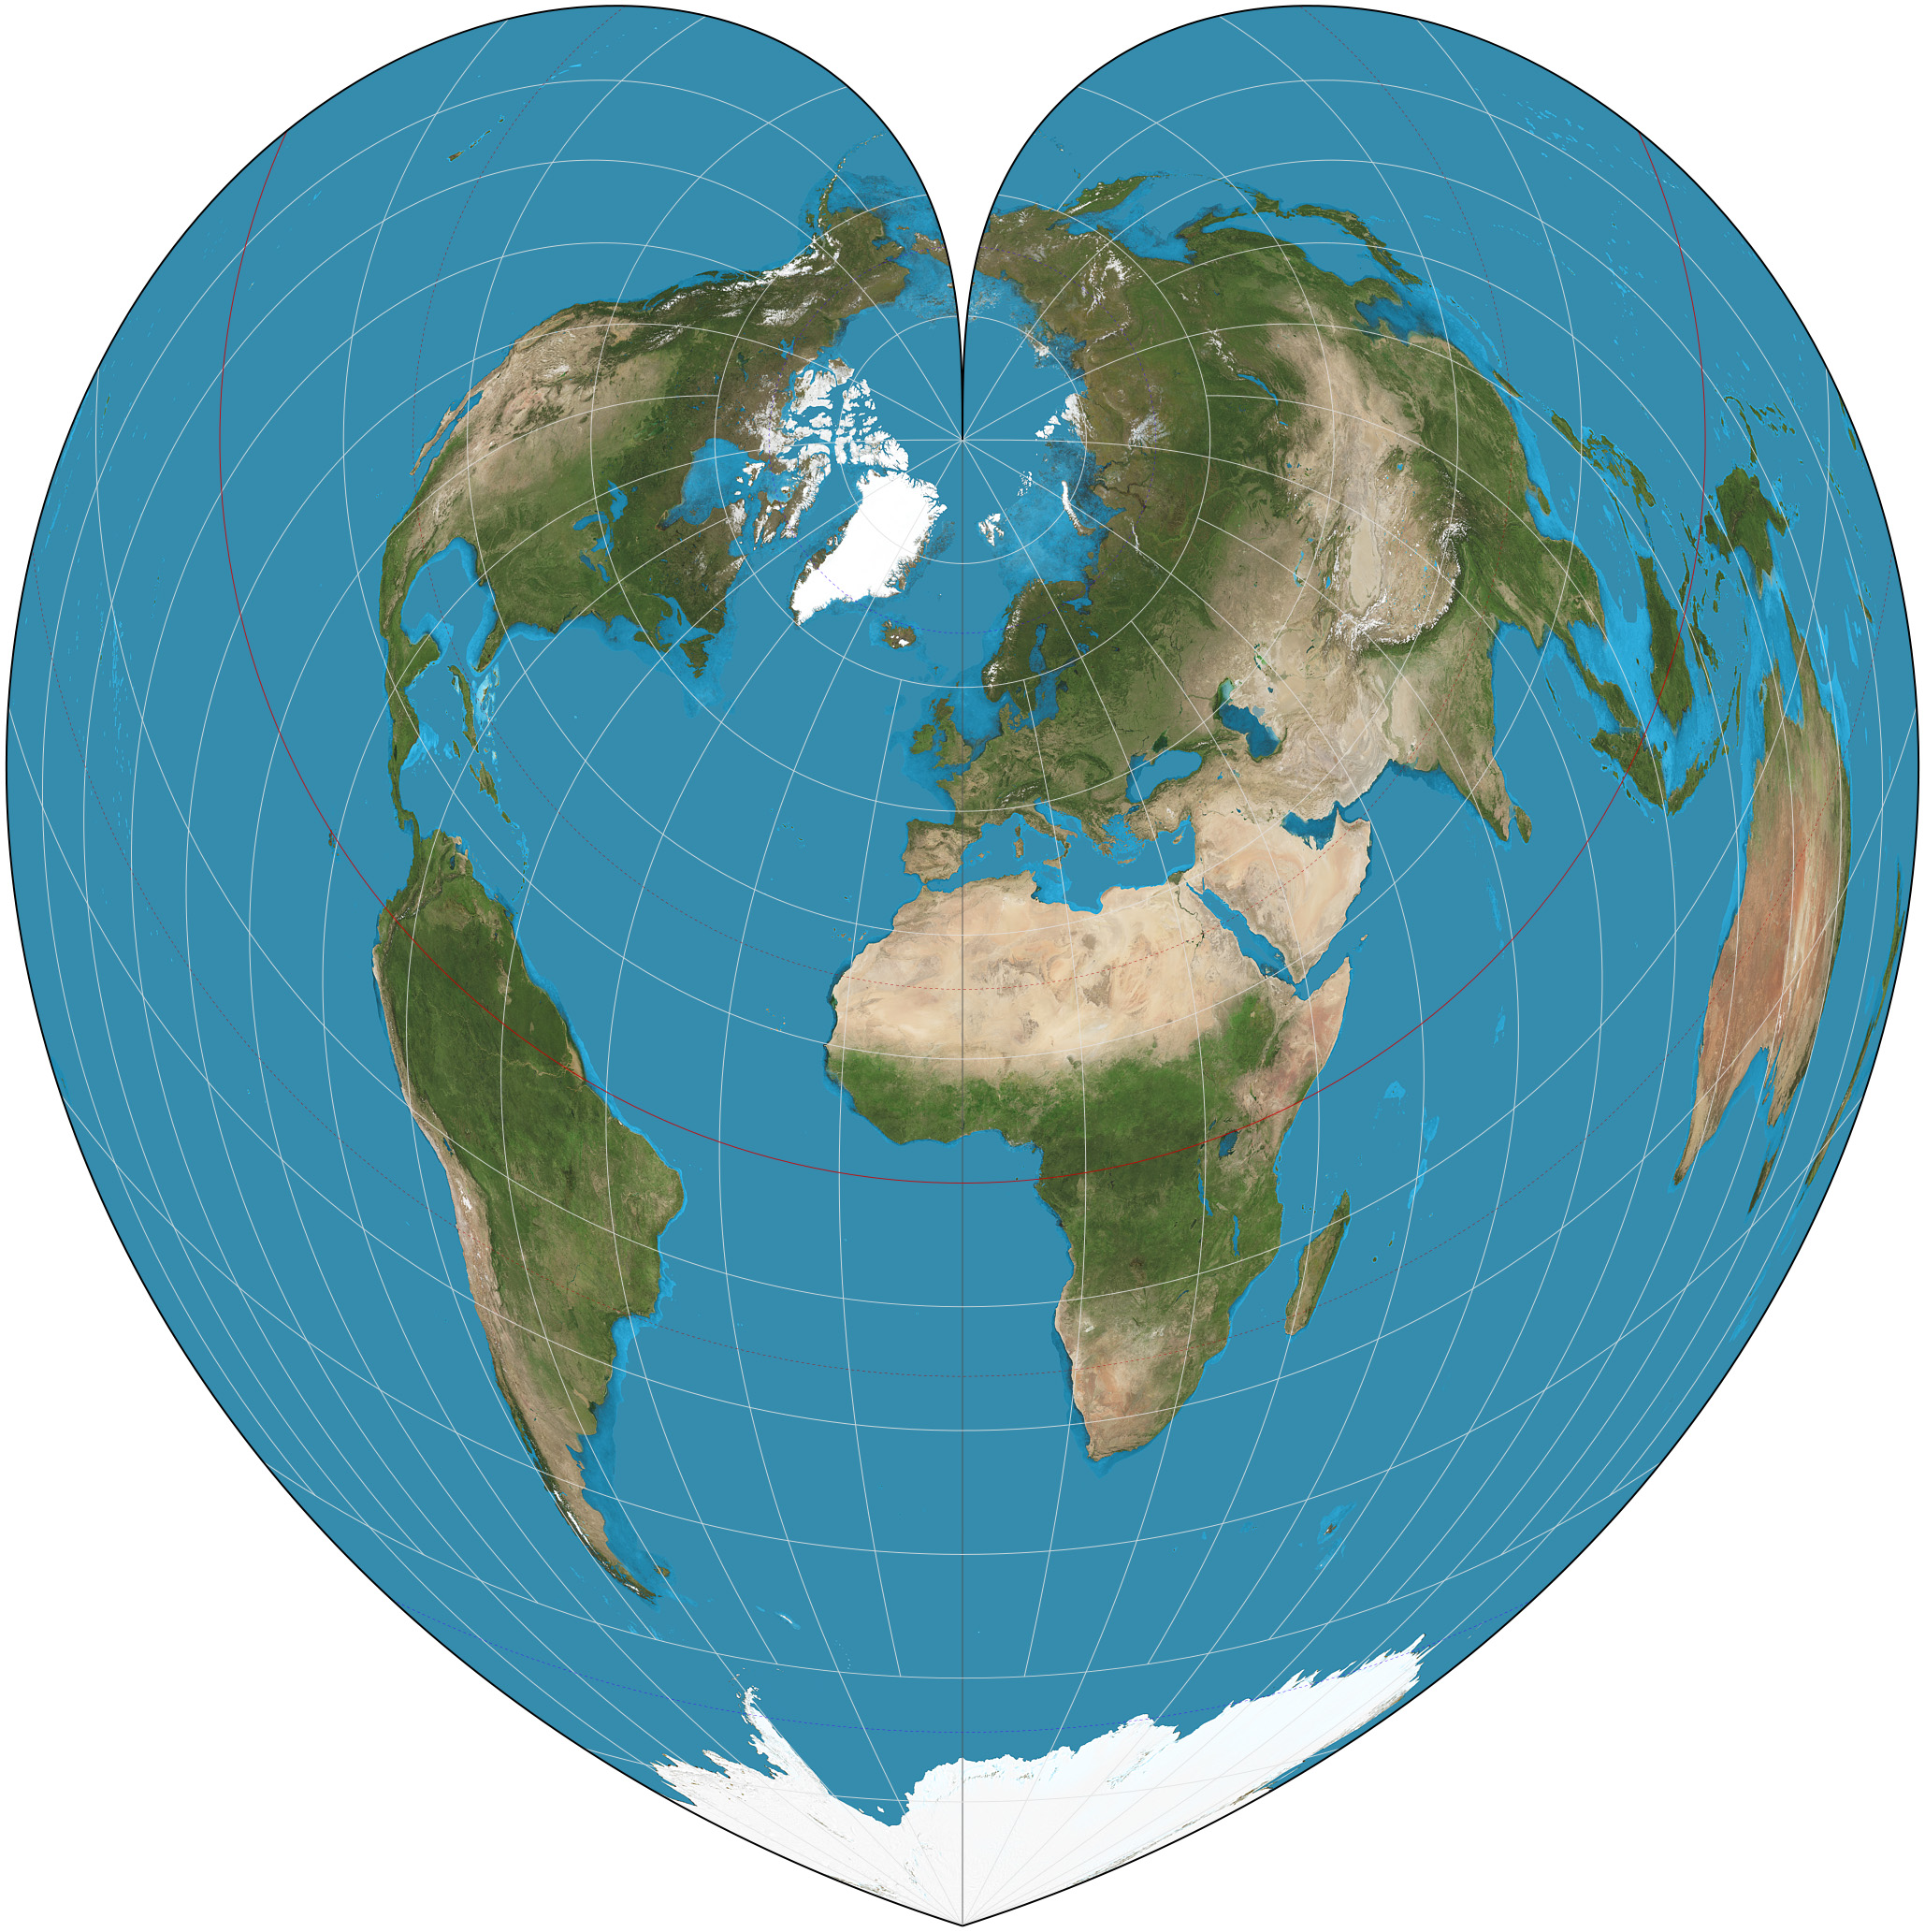
The Bottomley map projection is a pseudoconical equal area map projection defined as: :x = \frac, \qquad y = \frac - \rho \cos E \, where :\rho = \frac - \varphi, \qquad E = \frac and ''φ'' is the latitude, ''λ'' is the longitude from the central meridian, and ''φ''1 is the given parallel of the projection which determines its shape, all in radians. The inverse projection is then given by: :\begin\varphi &= \frac - \rho \\ \lambda &=\frac \end where :\rho = \sqrt, \qquad E= \tan^\left(\frac\right). Parallels (i.e. lines of latitude) are concentric elliptical arcs of constant eccentricity equal to cos ''φ''1, centred on the north pole. On the central meridian, shapes are not distorted, but elsewhere they are. Different projections can be produced by altering the eccentricity of the arcs, making it vary between the sinusoidal projection and the Werner projection. For larger values of ''φ''1, it produces a heart shape. It was introduced by Henry Bottomley as ... [...More Info...] [...Related Items...] OR: [Wikipedia] [Google] [Baidu] |
Werner Projection
The Werner projection is a pseudoconic equal-area map projection sometimes called the Stab-Werner or Stabius-Werner projection. Like other heart-shaped projections, it is also categorized as cordiform. ''Stab-Werner'' refers to two originators: Johannes Werner (1466–1528), a parish priest in Nuremberg, refined and promoted this projection that had been developed earlier by Johannes Stabius (Stab) of Vienna around 1500. The projection is a limiting form of the Bonne projection, having its standard parallel at one of the poles (90°N/S).. Distances along each parallel and along the central meridian are correct, as are all distances from the north pole. See also *List of map projections This is a summary of map projections that have articles of their own on Wikipedia or that are otherwise notable. Because there is no limit to the number of possible map projections, there can be no comprehensive list. Table of projections * ... References External links * *. {{Map ... [...More Info...] [...Related Items...] OR: [Wikipedia] [Google] [Baidu] |
Sinusoidal With Tissot's Indicatrices Of Distortion
A sine wave, sinusoidal wave, or just sinusoid is a mathematical curve defined in terms of the '' sine'' trigonometric function, of which it is the graph. It is a type of continuous wave and also a smooth periodic function. It occurs often in mathematics, as well as in physics, engineering, signal processing and many other fields. Formulation Its most basic form as a function of time (''t'') is: y(t) = A\sin(2 \pi f t + \varphi) = A\sin(\omega t + \varphi) where: * ''A'', ''amplitude'', the peak deviation of the function from zero. * ''f'', ''ordinary frequency'', the ''number'' of oscillations (cycles) that occur each second of time. * ''ω'' = 2''f'', ''angular frequency'', the rate of change of the function argument in units of radians per second. * \varphi, ''phase'', specifies (in radians) where in its cycle the oscillation is at ''t'' = 0. When \varphi is non-zero, the entire waveform appears to be shifted in time by the amount ''φ''/''ω'' seconds. A negative value r ... [...More Info...] [...Related Items...] OR: [Wikipedia] [Google] [Baidu] |


