|
Seed-based D Mapping
Seed-based d mapping (formerly Signed differential mapping) or SDM is a statistical technique created by Joaquim Radua for meta-analyzing studies on differences in brain activity or structure which used neuroimaging techniques such as fMRI, VBM, DTI or PET. It may also refer to a specific piece of software created by the SDM Project to carry out such meta-analyses. The seed-based d mapping approach Overview of the method SDM adopted and combined various positive features from previous methods, such as ALE or MKDA, and introduced a series of improvements and novel features. One of the new features, introduced to avoid positive and negative findings in the same voxel as seen in previous methods, was the representation of both positive differences and negative differences in the same map, thus obtaining a signed differential map (SDM). Another relevant feature, introduced in version 2.11, was the use of effect sizes (leading to effect-size SDM or 'ES-SDM'), which allows combinat ... [...More Info...] [...Related Items...] OR: [Wikipedia] [Google] [Baidu] |
|
 |
Statistical
Statistics (from German: '' Statistik'', "description of a state, a country") is the discipline that concerns the collection, organization, analysis, interpretation, and presentation of data. In applying statistics to a scientific, industrial, or social problem, it is conventional to begin with a statistical population or a statistical model to be studied. Populations can be diverse groups of people or objects such as "all people living in a country" or "every atom composing a crystal". Statistics deals with every aspect of data, including the planning of data collection in terms of the design of surveys and experiments.Dodge, Y. (2006) ''The Oxford Dictionary of Statistical Terms'', Oxford University Press. When census data cannot be collected, statisticians collect data by developing specific experiment designs and survey samples. Representative sampling assures that inferences and conclusions can reasonably extend from the sample to the population as a whole. An expe ... [...More Info...] [...Related Items...] OR: [Wikipedia] [Google] [Baidu] |
|
Bias Of An Estimator
In statistics, the bias of an estimator (or bias function) is the difference between this estimator's expected value and the true value of the parameter being estimated. An estimator or decision rule with zero bias is called ''unbiased''. In statistics, "bias" is an property of an estimator. Bias is a distinct concept from consistency: consistent estimators converge in probability to the true value of the parameter, but may be biased or unbiased; see bias versus consistency for more. All else being equal, an unbiased estimator is preferable to a biased estimator, although in practice, biased estimators (with generally small bias) are frequently used. When a biased estimator is used, bounds of the bias are calculated. A biased estimator may be used for various reasons: because an unbiased estimator does not exist without further assumptions about a population; because an estimator is difficult to compute (as in unbiased estimation of standard deviation); because a biased esti ... [...More Info...] [...Related Items...] OR: [Wikipedia] [Google] [Baidu] |
|
 |
Monte Carlo Method
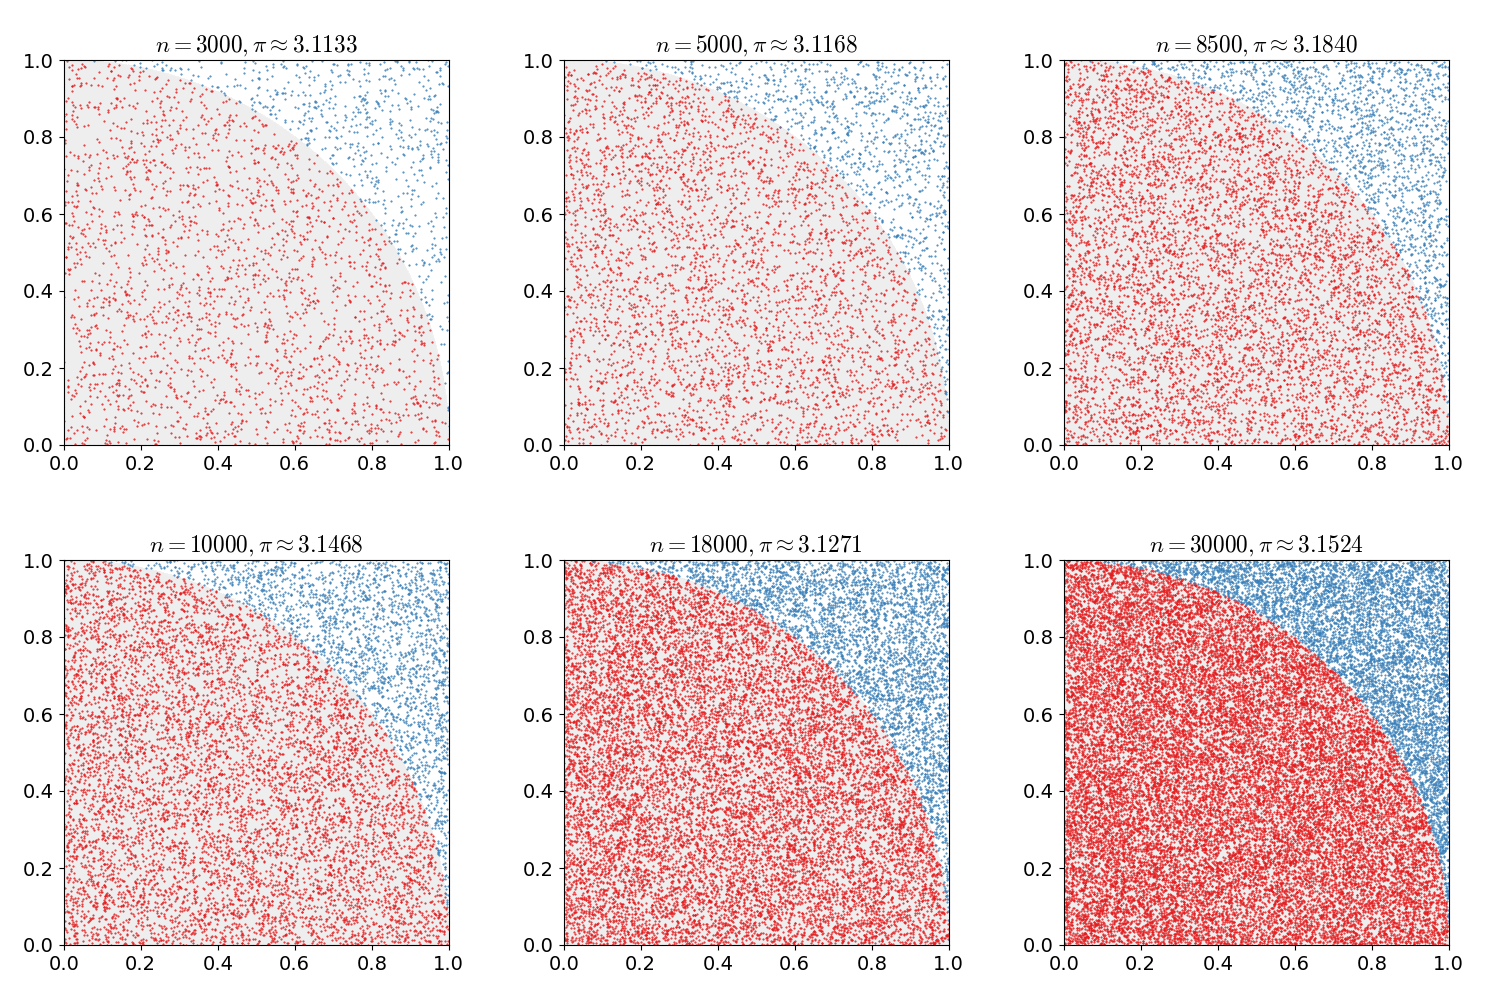
Monte Carlo methods, or Monte Carlo experiments, are a broad class of computational algorithms that rely on repeated random sampling to obtain numerical results. The underlying concept is to use randomness to solve problems that might be deterministic in principle. They are often used in physical and mathematical problems and are most useful when it is difficult or impossible to use other approaches. Monte Carlo methods are mainly used in three problem classes: optimization, numerical integration, and generating draws from a probability distribution. In physics-related problems, Monte Carlo methods are useful for simulating systems with many coupled degrees of freedom, such as fluids, disordered materials, strongly coupled solids, and cellular structures (see cellular Potts model, interacting particle systems, McKean–Vlasov processes, kinetic models of gases). Other examples include modeling phenomena with significant uncertainty in inputs such as the calculation of ... [...More Info...] [...Related Items...] OR: [Wikipedia] [Google] [Baidu] |
 |
Statistical Significance
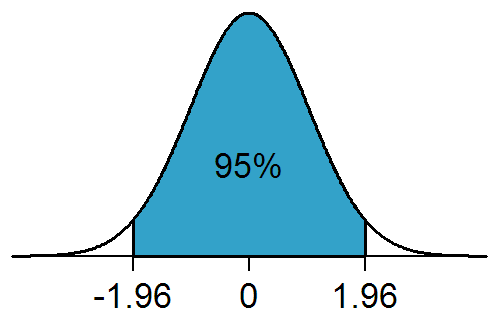
In statistical hypothesis testing, a result has statistical significance when it is very unlikely to have occurred given the null hypothesis (simply by chance alone). More precisely, a study's defined significance level, denoted by \alpha, is the probability of the study rejecting the null hypothesis, given that the null hypothesis is true; and the ''p''-value of a result, ''p'', is the probability of obtaining a result at least as extreme, given that the null hypothesis is true. The result is statistically significant, by the standards of the study, when p \le \alpha. The significance level for a study is chosen before data collection, and is typically set to 5% or much lower—depending on the field of study. In any experiment or observation that involves drawing a sample from a population, there is always the possibility that an observed effect would have occurred due to sampling error alone. But if the ''p''-value of an observed effect is less than (or equal to) the significan ... [...More Info...] [...Related Items...] OR: [Wikipedia] [Google] [Baidu] |
 |
Resampling (statistics)
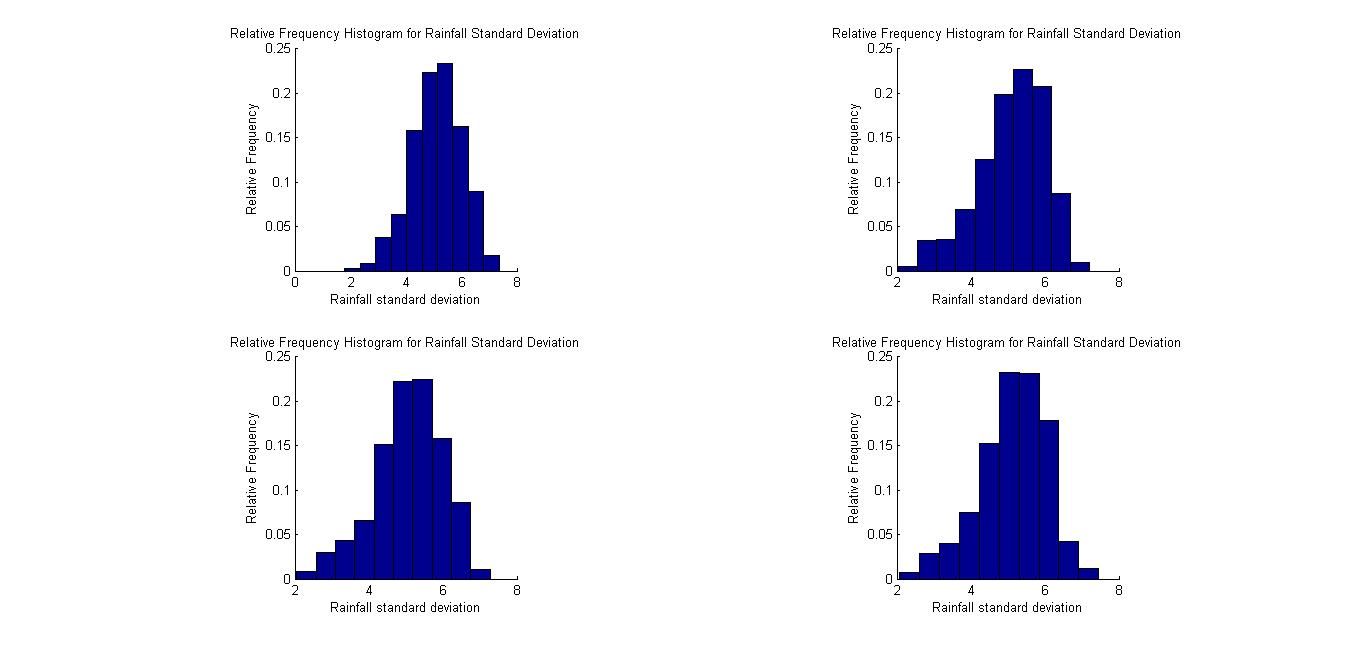
In statistics, resampling is the creation of new samples based on one observed sample. Resampling methods are: # Permutation tests (also re-randomization tests) # Bootstrapping # Cross validation Permutation tests Permutation tests rely on resampling the original data assuming the null hypothesis. Based on the resampled data it can be concluded how likely the original data is to occur under the null hypothesis. Bootstrap Bootstrapping is a statistical method for estimating the sampling distribution of an estimator by sampling with replacement from the original sample, most often with the purpose of deriving robust estimates of standard errors and confidence intervals of a population parameter like a mean, median, proportion, odds ratio, correlation coefficient or regression coefficient. It has been called the plug-in principle,Logan, J. David and Wolesensky, Willian R. Mathematical methods in biology. Pure and Applied Mathematics: a Wiley-interscience Series of Texts, M ... [...More Info...] [...Related Items...] OR: [Wikipedia] [Google] [Baidu] |
|
Confounding
In statistics, a confounder (also confounding variable, confounding factor, extraneous determinant or lurking variable) is a variable that influences both the dependent variable and independent variable, causing a spurious association. Confounding is a causal concept, and as such, cannot be described in terms of correlations or associations.Pearl, J., (2009). Simpson's Paradox, Confounding, and Collapsibility In ''Causality: Models, Reasoning and Inference'' (2nd ed.). New York : Cambridge University Press. The existence of confounders is an important quantitative explanation why correlation does not imply causation. Confounds are threats to internal validity. Definition Confounding is defined in terms of the data generating model. Let ''X'' be some independent variable, and ''Y'' some dependent variable. To estimate the effect of ''X'' on ''Y'', the statistician must suppress the effects of extraneous variables that influence both ''X'' and ''Y''. We say that ''X'' a ... [...More Info...] [...Related Items...] OR: [Wikipedia] [Google] [Baidu] |
|
|
Linear Model
In statistics, the term linear model is used in different ways according to the context. The most common occurrence is in connection with regression models and the term is often taken as synonymous with linear regression model. However, the term is also used in time series analysis with a different meaning. In each case, the designation "linear" is used to identify a subclass of models for which substantial reduction in the complexity of the related statistical theory is possible. Linear regression models For the regression case, the statistical model is as follows. Given a (random) sample (Y_i, X_, \ldots, X_), \, i = 1, \ldots, n the relation between the observations Y_i and the independent variables X_ is formulated as :Y_i = \beta_0 + \beta_1 \phi_1(X_) + \cdots + \beta_p \phi_p(X_) + \varepsilon_i \qquad i = 1, \ldots, n where \phi_1, \ldots, \phi_p may be nonlinear functions. In the above, the quantities \varepsilon_i are random variables representing errors in ... [...More Info...] [...Related Items...] OR: [Wikipedia] [Google] [Baidu] |
|
|
Subgroup Analysis
Subgroup analysis refers to repeating the analysis of a study within subgroups of subjects defined by a subgrouping variable (e.g. smoking status defining two subgroups: smokers and non-smokers). Aim The aim of subgroup analysis is usually to assess whether the association of two variables differs depending on a third variable. For instance, investigators of a study testing the effect of an intervention (variable 1) on preventing heart attacks (variable 2) might be interested in whether the effect varies by smoking status (variable 3). Therefore, they could perform separate analyses for smokers and non-smokers, and then compare the results. If results differ, there is a subgroup effect. Terminology The terminology is inconsistent. Alternative names for subgrouping variables include effect modifiers, predictive factors, or moderators. Alternative names for subgroup effects include effect modification and interaction. Some authors define effect modification and interaction differe ... [...More Info...] [...Related Items...] OR: [Wikipedia] [Google] [Baidu] |
|
|
Weight Function
A weight function is a mathematical device used when performing a sum, integral, or average to give some elements more "weight" or influence on the result than other elements in the same set. The result of this application of a weight function is a weighted sum or weighted average. Weight functions occur frequently in statistics and analysis, and are closely related to the concept of a measure. Weight functions can be employed in both discrete and continuous settings. They can be used to construct systems of calculus called "weighted calculus" and "meta-calculus".Jane Grossma''Meta-Calculus: Differential and Integral'' , 1981. Discrete weights General definition In the discrete setting, a weight function w \colon A \to \R^+ is a positive function defined on a discrete set A, which is typically finite or countable. The weight function w(a) := 1 corresponds to the ''unweighted'' situation in which all elements have equal weight. One can then apply this weight to various con ... [...More Info...] [...Related Items...] OR: [Wikipedia] [Google] [Baidu] |
|
|
Mean
There are several kinds of mean in mathematics, especially in statistics. Each mean serves to summarize a given group of data, often to better understand the overall value ( magnitude and sign) of a given data set. For a data set, the '' arithmetic mean'', also known as "arithmetic average", is a measure of central tendency of a finite set of numbers: specifically, the sum of the values divided by the number of values. The arithmetic mean of a set of numbers ''x''1, ''x''2, ..., x''n'' is typically denoted using an overhead bar, \bar. If the data set were based on a series of observations obtained by sampling from a statistical population, the arithmetic mean is the '' sample mean'' (\bar) to distinguish it from the mean, or expected value, of the underlying distribution, the '' population mean'' (denoted \mu or \mu_x).Underhill, L.G.; Bradfield d. (1998) ''Introstat'', Juta and Company Ltd.p. 181/ref> Outside probability and statistics, a wide range of other notions of m ... [...More Info...] [...Related Items...] OR: [Wikipedia] [Google] [Baidu] |
|
 |
Coregistration
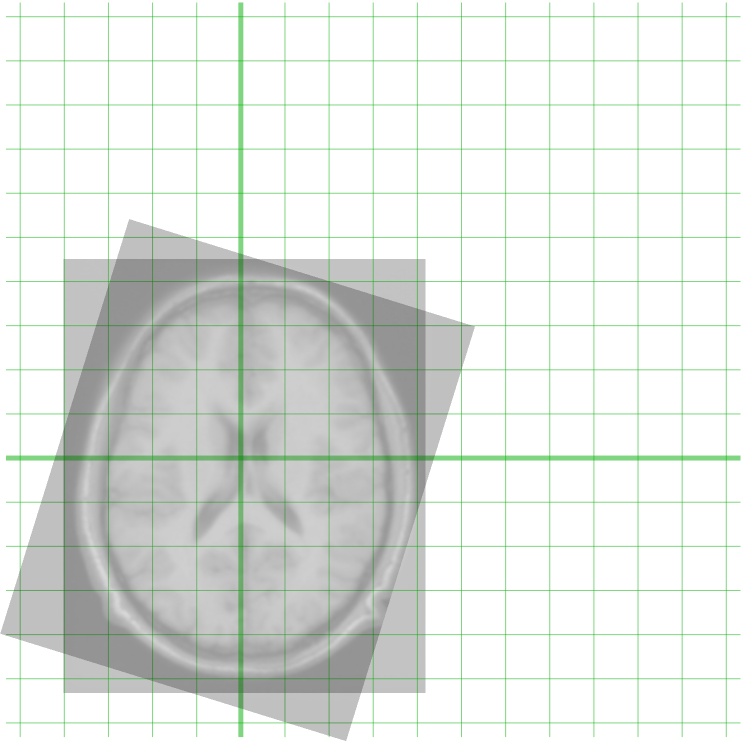
Image registration is the process of transforming different sets of data into one coordinate system. Data may be multiple photographs, data from different sensors, times, depths, or viewpoints. It is used in computer vision, medical imaging, military automatic target recognition, and compiling and analyzing images and data from satellites. Registration is necessary in order to be able to compare or integrate the data obtained from these different measurements. Algorithm classification Intensity-based vs feature-based Image registration or image alignment algorithms can be classified into intensity-based and feature-based.A. Ardeshir Goshtasby2-D and 3-D Image Registration for Medical, Remote Sensing, and Industrial Applications Wiley Press, 2005. One of the images is referred to as the ''moving'' or ''source'' and the others are referred to as the ''target'', ''fixed'' or ''sensed'' images. Image registration involves spatially transforming the source/moving image(s) to alig ... [...More Info...] [...Related Items...] OR: [Wikipedia] [Google] [Baidu] |
|
Full Width At Half Maximum
In a distribution, full width at half maximum (FWHM) is the difference between the two values of the independent variable at which the dependent variable is equal to half of its maximum value. In other words, it is the width of a spectrum curve measured between those points on the ''y''-axis which are half the maximum amplitude. Half width at half maximum (HWHM) is half of the FWHM if the function is symmetric. The term full duration at half maximum (FDHM) is preferred when the independent variable is time. FWHM is applied to such phenomena as the duration of pulse (signal processing), pulse waveforms and the spectral width of sources used for optical telecommunication, communications and the resolution of spectrometers. The convention of "width" meaning "half maximum" is also widely used in signal processing to define bandwidth (signal processing), bandwidth as "width of frequency range where less than half the signal's power is attenuated", i.e., the power is at least half the max ... [...More Info...] [...Related Items...] OR: [Wikipedia] [Google] [Baidu] |