|
Granger Causality
The Granger causality test is a statistical hypothesis test for determining whether one time series is useful in forecasting another, first proposed in 1969. Ordinarily, regressions reflect "mere" correlations, but Clive Granger argued that causality in economics could be tested for by measuring the ability to predict the future values of a time series using prior values of another time series. Since the question of "true causality" is deeply philosophical, and because of the post hoc ergo propter hoc fallacy of assuming that one thing preceding another can be used as a proof of causation, econometricians assert that the Granger test finds only "predictive causality". Using the term "causality" alone is a misnomer, as Granger-causality is better described as "precedence", or, as Granger himself later claimed in 1977, "temporally related". Rather than testing whether ''X'' ''causes'' Y, the Granger causality tests whether X ''forecasts'' ''Y.'' A time series ''X'' is said to Gra ... [...More Info...] [...Related Items...] OR: [Wikipedia] [Google] [Baidu] |
Akaike Information Criterion
The Akaike information criterion (AIC) is an estimator of prediction error and thereby relative quality of statistical models for a given set of data. Given a collection of models for the data, AIC estimates the quality of each model, relative to each of the other models. Thus, AIC provides a means for model selection. AIC is founded on information theory. When a statistical model is used to represent the process that generated the data, the representation will almost never be exact; so some information will be lost by using the model to represent the process. AIC estimates the relative amount of information lost by a given model: the less information a model loses, the higher the quality of that model. In estimating the amount of information lost by a model, AIC deals with the trade-off between the goodness of fit of the model and the simplicity of the model. In other words, AIC deals with both the risk of overfitting and the risk of underfitting. The Akaike information criterion ... [...More Info...] [...Related Items...] OR: [Wikipedia] [Google] [Baidu] |
Point Process
In statistics and probability theory, a point process or point field is a collection of mathematical points randomly located on a mathematical space such as the real line or Euclidean space. Kallenberg, O. (1986). ''Random Measures'', 4th edition. Academic Press, New York, London; Akademie-Verlag, Berlin. , .Daley, D.J, Vere-Jones, D. (1988). ''An Introduction to the Theory of Point Processes''. Springer, New York. , . Point processes can be used for spatial data analysis,Diggle, P. (2003). ''Statistical Analysis of Spatial Point Patterns'', 2nd edition. Arnold, London. . which is of interest in such diverse disciplines as forestry, plant ecology, epidemiology, geography, seismology, materials science, astronomy, telecommunications, computational neuroscience, economics and others. There are different mathematical interpretations of a point process, such as a random counting measure or a random set. Some authors regard a point process and stochastic process as two different objects ... [...More Info...] [...Related Items...] OR: [Wikipedia] [Google] [Baidu] |
Spike Train
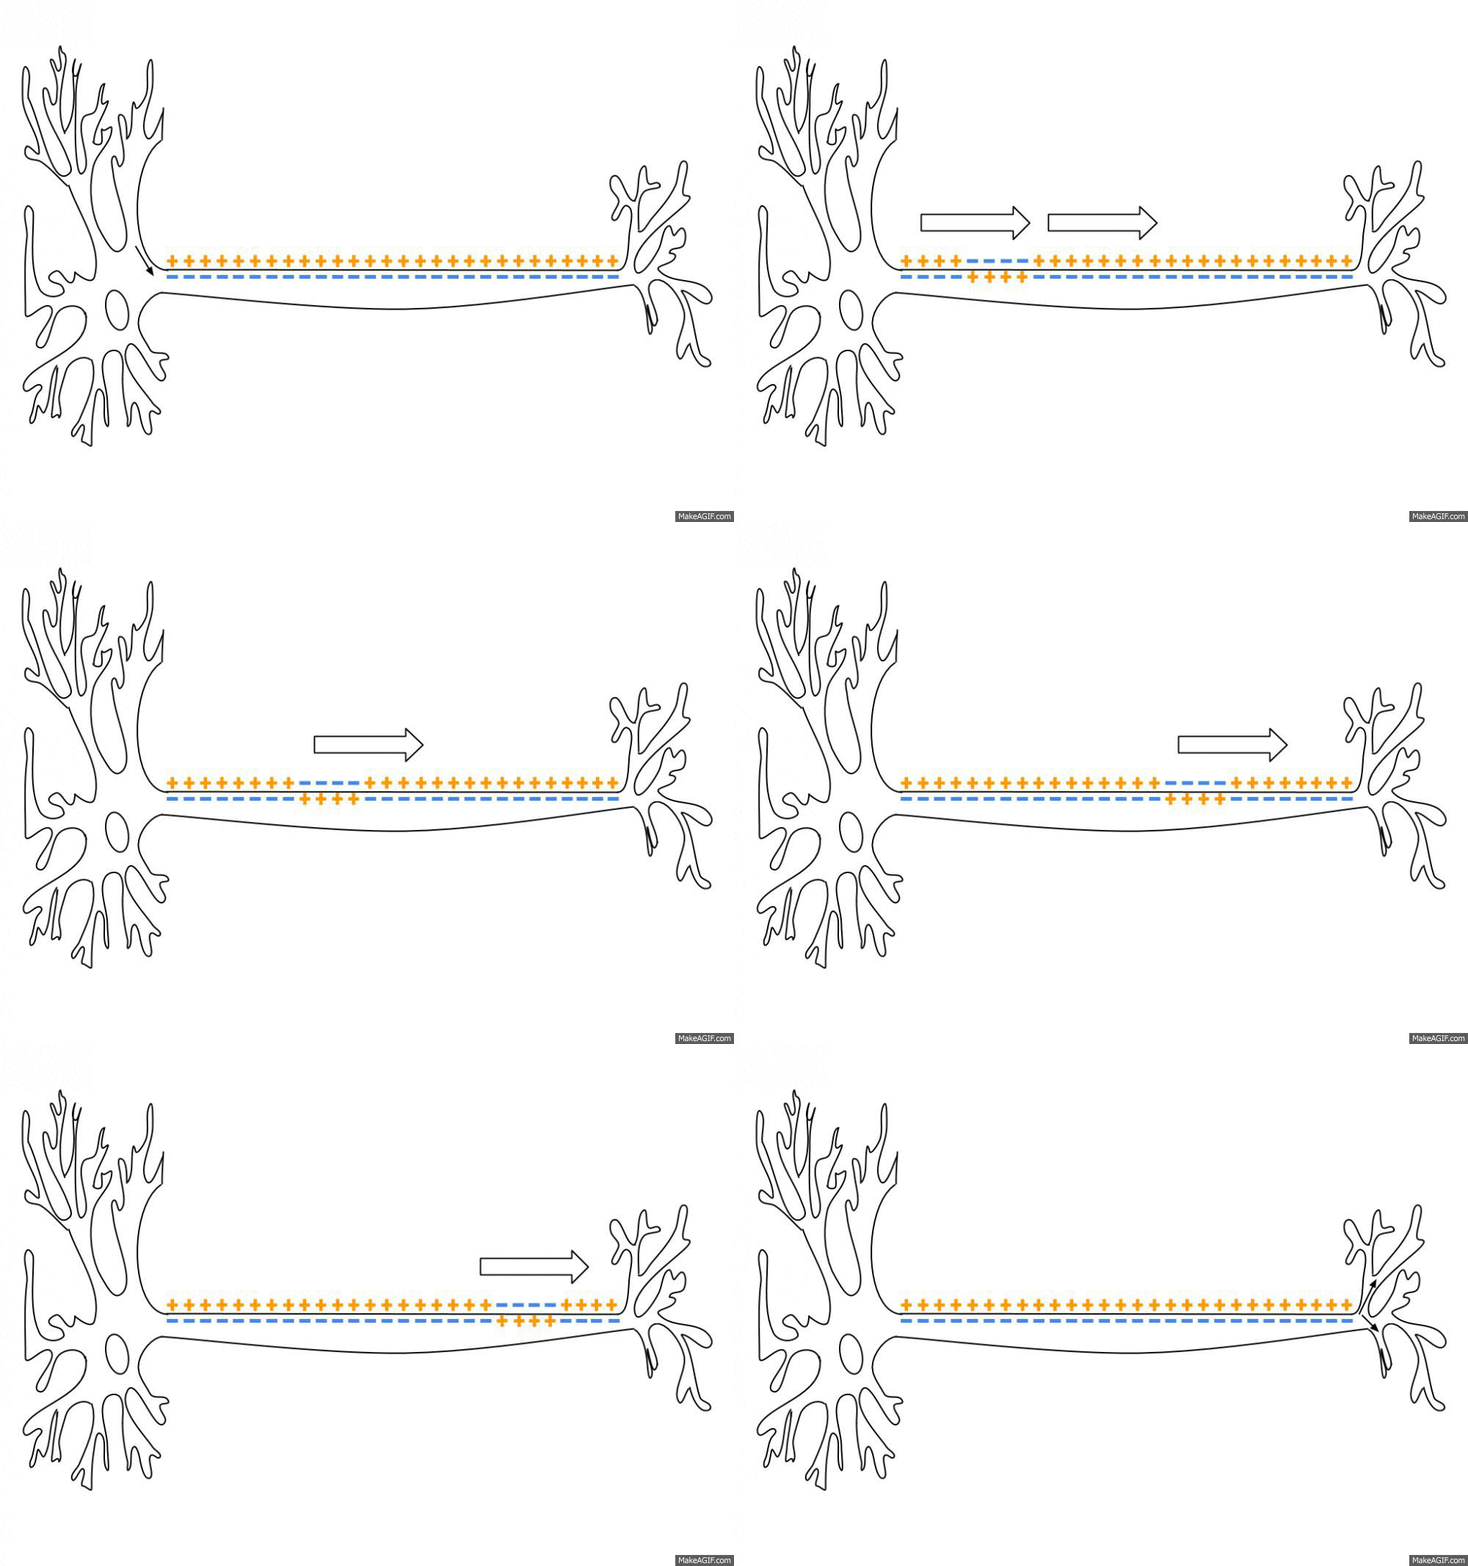
An action potential occurs when the membrane potential of a specific cell location rapidly rises and falls. This depolarization then causes adjacent locations to similarly depolarize. Action potentials occur in several types of animal cells, called excitable cells, which include neurons, muscle cells, and in some plant cells. Certain endocrine cells such as pancreatic beta cells, and certain cells of the anterior pituitary gland are also excitable cells. In neurons, action potentials play a central role in cell-cell communication by providing for—or with regard to saltatory conduction, assisting—the propagation of signals along the neuron's axon toward synaptic boutons situated at the ends of an axon; these signals can then connect with other neurons at synapses, or to motor cells or glands. In other types of cells, their main function is to activate intracellular processes. In muscle cells, for example, an action potential is the first step in the chain of events leadi ... [...More Info...] [...Related Items...] OR: [Wikipedia] [Google] [Baidu] |
Stochastic Processes
In probability theory and related fields, a stochastic () or random process is a mathematical object usually defined as a family of random variables. Stochastic processes are widely used as mathematical models of systems and phenomena that appear to vary in a random manner. Examples include the growth of a bacterial population, an electrical current fluctuating due to thermal noise, or the movement of a gas molecule. Stochastic processes have applications in many disciplines such as biology, chemistry, ecology, neuroscience, physics, image processing, signal processing, control theory, information theory, computer science, cryptography and telecommunications. Furthermore, seemingly random changes in financial markets have motivated the extensive use of stochastic processes in finance. Applications and the study of phenomena have in turn inspired the proposal of new stochastic processes. Examples of such stochastic processes include the Wiener process or Brownian motion pro ... [...More Info...] [...Related Items...] OR: [Wikipedia] [Google] [Baidu] |
Small-world Networks
A small-world network is a type of mathematical graph in which most nodes are not neighbors of one another, but the neighbors of any given node are likely to be neighbors of each other and most nodes can be reached from every other node by a small number of hops or steps. Specifically, a small-world network is defined to be a network where the typical distance ''L'' between two randomly chosen nodes (the number of steps required) grows proportionally to the logarithm of the number of nodes ''N'' in the network, that is: :L \propto \log N while the global clustering coefficient is not small. In the context of a social network, this results in the small world phenomenon of strangers being linked by a short chain of acquaintances. Many empirical graphs show the small-world effect, including social networks, wikis such as Wikipedia, gene networks, and even the underlying architecture of the Internet. It is the inspiration for many network-on-chip architectures in contempor ... [...More Info...] [...Related Items...] OR: [Wikipedia] [Google] [Baidu] |
Functional Connectivity
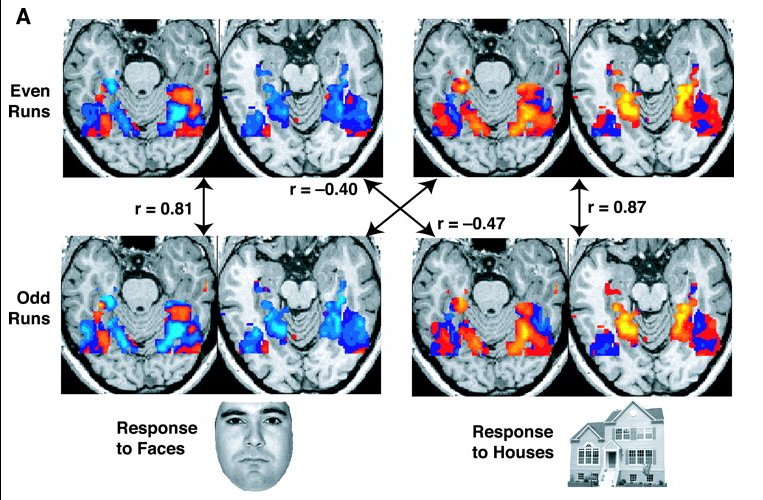
Resting state fMRI (rs-fMRI or R-fMRI) is a method of functional magnetic resonance imaging (fMRI) that is used in brain mapping to evaluate regional interactions that occur in a resting or task-negative state, when an explicit task is not being performed. A number of resting-state brain networks have been identified, one of which is the default mode network. These brain networks are observed through changes in blood flow in the brain which creates what is referred to as a blood-oxygen-level dependent (BOLD) signal that can be measured using fMRI. Because brain activity is intrinsic, present even in the absence of an externally prompted task, any brain region will have spontaneous fluctuations in BOLD signal. The resting state approach is useful to explore the brain's functional organization and to examine if it is altered in neurological or mental disorders. Because of the resting state aspect of this imaging, data can be collected from a range of patient groups including peop ... [...More Info...] [...Related Items...] OR: [Wikipedia] [Google] [Baidu] |
Alternative Hypothesis
In statistical hypothesis testing, the alternative hypothesis is one of the proposed proposition in the hypothesis test. In general the goal of hypothesis test is to demonstrate that in the given condition, there is sufficient evidence supporting the credibility of alternative hypothesis instead of the exclusive proposition in the test (null hypothesis). It is usually consistent with the research hypothesis because it is constructed from literature review, previous studies, etc. However, the research hypothesis is sometimes consistent with the null hypothesis. In statistics, alternative hypothesis is often denoted as Ha or H1. Hypotheses are formulated to compare in a statistical hypothesis test. In the domain of inferential statistics two rival hypotheses can be compared by explanatory power and predictive power. Basic definition The ''alternative hypothesis'' and ''null hypothesis'' are types of conjectures used in statistical tests, which are formal methods of reaching ... [...More Info...] [...Related Items...] OR: [Wikipedia] [Google] [Baidu] |
Humean Definition Of Causality
David Hume coined a sceptical, reductionist viewpoint on causality that inspired the logical-positivist definition of empirical law that "is a regularity or universal generalization of the form 'All Cs are Es' or, whenever C, then E". The Scottish philosopher and economist believed that human mind is not equipped with the a priori ability to observe causal relations. What can be experienced is one event following another. The reductionist approach to causation can be exemplified with the case of two billiard balls: one ball is moving, hits another one and stops, and the second ball is moving. In ''A Treatise of Human Nature'' Hume coined two definitions of the cause in a following way: also fixed eight general rules that can help in recognizing which objects are in cause-effect relation, the main four are as following: See also *Humeanism Humeanism refers to the philosophy of David Hume and to the tradition of thought inspired by him. Hume was an influential Scottish ph ... [...More Info...] [...Related Items...] OR: [Wikipedia] [Google] [Baidu] |
Parametric Model
In statistics, a parametric model or parametric family or finite-dimensional model is a particular class of statistical models. Specifically, a parametric model is a family of probability distributions that has a finite number of parameters. Definition A statistical model is a collection of probability distributions on some sample space. We assume that the collection, , is indexed by some set . The set is called the parameter set or, more commonly, the parameter space. For each , let denote the corresponding member of the collection; so is a cumulative distribution function. Then a statistical model can be written as : \mathcal = \big\. The model is a parametric model if for some positive integer . When the model consists of absolutely continuous distributions, it is often specified in terms of corresponding probability density functions: : \mathcal = \big\. Examples * The Poisson family of distributions is parametrized by a single number : : \m ... [...More Info...] [...Related Items...] OR: [Wikipedia] [Google] [Baidu] |
Vector Autoregression
Vector autoregression (VAR) is a statistical model used to capture the relationship between multiple quantities as they change over time. VAR is a type of stochastic process model. VAR models generalize the single-variable (univariate) autoregressive model by allowing for multivariate time series. VAR models are often used in economics and the natural sciences. Like the autoregressive model, each variable has an equation modelling its evolution over time. This equation includes the variable's lagged (past) values, the lagged values of the other variables in the model, and an error term. VAR models do not require as much knowledge about the forces influencing a variable as do structural models with simultaneous equations. The only prior knowledge required is a list of variables which can be hypothesized to affect each other over time. Specification Definition A VAR model describes the evolution of a set of ''k'' variables, called ''endogenous variables'', over time. Each perio ... [...More Info...] [...Related Items...] OR: [Wikipedia] [Google] [Baidu] |
Autoregression
In statistics, econometrics and signal processing, an autoregressive (AR) model is a representation of a type of random process; as such, it is used to describe certain time-varying processes in nature, economics, etc. The autoregressive model specifies that the output variable depends linearly on its own previous values and on a stochastic term (an imperfectly predictable term); thus the model is in the form of a stochastic difference equation (or recurrence relation which should not be confused with differential equation). Together with the moving-average (MA) model, it is a special case and key component of the more general autoregressive–moving-average (ARMA) and autoregressive integrated moving average (ARIMA) models of time series, which have a more complicated stochastic structure; it is also a special case of the vector autoregressive model (VAR), which consists of a system of more than one interlocking stochastic difference equation in more than one evolving random vari ... [...More Info...] [...Related Items...] OR: [Wikipedia] [Google] [Baidu] |


