|
Box's M Test
Box's ''M'' test is a multivariate statistical test used to check the equality of multiple variance-covariance matrices. The test is commonly used to test the assumption of homogeneity of variances and covariances in MANOVA and linear discriminant analysis. It is named after George E. P. Box George Edward Pelham Box (18 October 1919 – 28 March 2013) was a British statistician, who worked in the areas of quality control, time-series analysis, design of experiments, and Bayesian inference. He has been called "one of the gre ..., who first discussed the test in 1949. The test uses a chi-squared approximation. Box's ''M'' test is susceptible to errors if the data does not meet model assumptions or if the sample size is too large or small. Box's ''M'' test is especially prone to error if the data does not meet the assumption of multivariate normality. See also * Bartlett's test * Levene's test References Multivariate statistics Statistical hypothesis testing< ... [...More Info...] [...Related Items...] OR: [Wikipedia] [Google] [Baidu] |
Variance-covariance Matrix
In probability theory and statistics, a covariance matrix (also known as auto-covariance matrix, dispersion matrix, variance matrix, or variance–covariance matrix) is a square matrix giving the covariance between each pair of elements of a given random vector. Any covariance matrix is symmetric and positive semi-definite and its main diagonal contains variances (i.e., the covariance of each element with itself). Intuitively, the covariance matrix generalizes the notion of variance to multiple dimensions. As an example, the variation in a collection of random points in two-dimensional space cannot be characterized fully by a single number, nor would the variances in the x and y directions contain all of the necessary information; a 2 \times 2 matrix would be necessary to fully characterize the two-dimensional variation. The covariance matrix of a random vector \mathbf is typically denoted by \operatorname_ or \Sigma. Definition Throughout this article, boldfaced unsubsc ... [...More Info...] [...Related Items...] OR: [Wikipedia] [Google] [Baidu] |
Homogeneity
Homogeneity and heterogeneity are concepts often used in the sciences and statistics relating to the uniformity of a substance or organism. A material or image that is homogeneous is uniform in composition or character (i.e. color, shape, size, weight, height, distribution, texture, language, income, disease, temperature, radioactivity, architectural design, etc.); one that is heterogeneous is distinctly nonuniform in at least one of these qualities. Heterogeneous Mixtures, in chemistry, is where certain elements are unwillingly combined and, when given the option, will separate. Etymology and spelling The words ''homogeneous'' and ''heterogeneous'' come from Medieval Latin ''homogeneus'' and ''heterogeneus'', from Ancient Greek ὁμογενής (''homogenēs'') and ἑτερογενής (''heterogenēs''), from ὁμός (''homos'', “same”) and ἕτερος (''heteros'', “other, another, different”) respectively, followed by γένος (''genos'', “kind”); -ou ... [...More Info...] [...Related Items...] OR: [Wikipedia] [Google] [Baidu] |
MANOVA
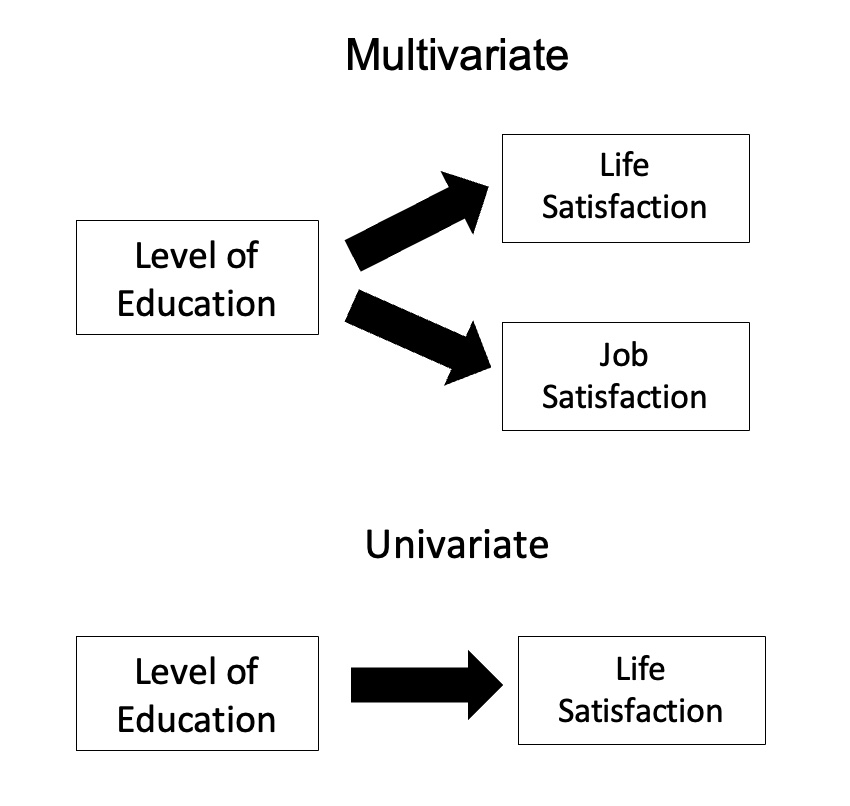
In statistics, multivariate analysis of variance (MANOVA) is a procedure for comparing multivariate sample means. As a multivariate procedure, it is used when there are two or more dependent variables, and is often followed by significance tests involving individual dependent variables separately. Without relation to the image, the dependent variables may be k life satisfactions scores measured at sequential time points and p job satisfaction scores measured at sequential time points. In this case there are k+p dependent variables whose linear combination follows a multivariate normal distribution, multivariate variance-covariance matrix homogeneity, and linear relationship, no multicollinearity, and each without outliers. Relationship with ANOVA MANOVA is a generalized form of univariate analysis of variance (ANOVA), although, unlike univariate ANOVA, it uses the covariance between outcome variables in testing the statistical significance of the mean differences. Where su ... [...More Info...] [...Related Items...] OR: [Wikipedia] [Google] [Baidu] |
Linear Discriminant Analysis
Linear discriminant analysis (LDA), normal discriminant analysis (NDA), or discriminant function analysis is a generalization of Fisher's linear discriminant, a method used in statistics and other fields, to find a linear combination of features that characterizes or separates two or more classes of objects or events. The resulting combination may be used as a linear classifier, or, more commonly, for dimensionality reduction before later classification. LDA is closely related to analysis of variance (ANOVA) and regression analysis, which also attempt to express one dependent variable as a linear combination of other features or measurements. However, ANOVA uses categorical independent variables and a continuous dependent variable, whereas discriminant analysis has continuous independent variables and a categorical dependent variable (''i.e.'' the class label). Logistic regression and probit regression are more similar to LDA than ANOVA is, as they also explain a categorica ... [...More Info...] [...Related Items...] OR: [Wikipedia] [Google] [Baidu] |
George E
George may refer to: People * George (given name) * George (surname) * George (singer), American-Canadian singer George Nozuka, known by the mononym George * George Washington, First President of the United States * George W. Bush, 43rd President of the United States * George H. W. Bush, 41st President of the United States * George V, King of Great Britain, Ireland, the British Dominions and Emperor of India from 1910-1936 * George VI, King of Great Britain, Ireland, the British Dominions and Emperor of India from 1936-1952 * Prince George of Wales * George Papagheorghe also known as Jorge / GEØRGE * George, stage name of Giorgio Moroder * George Harrison, an English musician and singer-songwriter Places South Africa * George, Western Cape ** George Airport United States * George, Iowa * George, Missouri * George, Washington * George County, Mississippi * George Air Force Base, a former U.S. Air Force base located in California Characters * George (Peppa Pig), a 2-year-ol ... [...More Info...] [...Related Items...] OR: [Wikipedia] [Google] [Baidu] |
Chi-squared Distribution
In probability theory and statistics, the chi-squared distribution (also chi-square or \chi^2-distribution) with k degrees of freedom is the distribution of a sum of the squares of k independent standard normal random variables. The chi-squared distribution is a special case of the gamma distribution and is one of the most widely used probability distributions in inferential statistics, notably in hypothesis testing and in construction of confidence intervals. This distribution is sometimes called the central chi-squared distribution, a special case of the more general noncentral chi-squared distribution. The chi-squared distribution is used in the common chi-squared tests for goodness of fit of an observed distribution to a theoretical one, the independence of two criteria of classification of qualitative data, and in confidence interval estimation for a population standard deviation of a normal distribution from a sample standard deviation. Many other statistical tes ... [...More Info...] [...Related Items...] OR: [Wikipedia] [Google] [Baidu] |
Multivariate Normal
In probability theory and statistics, the multivariate normal distribution, multivariate Gaussian distribution, or joint normal distribution is a generalization of the one-dimensional (univariate) normal distribution to higher dimensions. One definition is that a random vector is said to be ''k''-variate normally distributed if every linear combination of its ''k'' components has a univariate normal distribution. Its importance derives mainly from the multivariate central limit theorem. The multivariate normal distribution is often used to describe, at least approximately, any set of (possibly) correlated real-valued random variables each of which clusters around a mean value. Definitions Notation and parameterization The multivariate normal distribution of a ''k''-dimensional random vector \mathbf = (X_1,\ldots,X_k)^ can be written in the following notation: : \mathbf\ \sim\ \mathcal(\boldsymbol\mu,\, \boldsymbol\Sigma), or to make it explicitly known that ''X'' ... [...More Info...] [...Related Items...] OR: [Wikipedia] [Google] [Baidu] |
Bartlett's Test
In statistics, Bartlett's test, named after Maurice Stevenson Bartlett, is used to test homoscedasticity, that is, if multiple samples are from populations with equal variances. Some statistical tests, such as the analysis of variance, assume that variances are equal across groups or samples, which can be verified with Bartlett's test. In a Bartlett test, we construct the null and alternative hypothesis. For this purpose several test procedures have been devised. The test procedure due to M.S.E (Mean Square Error/Estimator) Bartlett test is represented here. This test procedure is based on the statistic whose sampling distribution is approximately a Chi-Square distribution with (''k'' − 1) degrees of freedom, where ''k'' is the number of random samples, which may vary in size and are each drawn from independent normal distributions. Bartlett's test is sensitive to departures from normality. That is, if the samples come from non-normal distributions, then Bartlett's test may sim ... [...More Info...] [...Related Items...] OR: [Wikipedia] [Google] [Baidu] |
Levene's Test
In statistics, Levene's test is an inferential statistic used to assess the equality of variances for a variable calculated for two or more groups. Some common statistical procedures assume that variances of the populations from which different samples are drawn are equal. Levene's test assesses this assumption. It tests the null hypothesis that the population variances are equal (called ''homogeneity of variance'' or ''homoscedasticity''). If the resulting ''p''-value of Levene's test is less than some significance level (typically 0.05), the obtained differences in sample variances are unlikely to have occurred based on random sampling from a population with equal variances. Thus, the null hypothesis of equal variances is rejected and it is concluded that there is a difference between the variances in the population. Some of the procedures typically assuming homoscedasticity, for which one can use Levene's tests, include analysis of variance and t-tests. Levene's test is so ... [...More Info...] [...Related Items...] OR: [Wikipedia] [Google] [Baidu] |
Multivariate Statistics
Multivariate statistics is a subdivision of statistics encompassing the simultaneous observation and analysis of more than one outcome variable. Multivariate statistics concerns understanding the different aims and background of each of the different forms of multivariate analysis, and how they relate to each other. The practical application of multivariate statistics to a particular problem may involve several types of univariate and multivariate analyses in order to understand the relationships between variables and their relevance to the problem being studied. In addition, multivariate statistics is concerned with multivariate probability distributions, in terms of both :*how these can be used to represent the distributions of observed data; :*how they can be used as part of statistical inference, particularly where several different quantities are of interest to the same analysis. Certain types of problems involving multivariate data, for example simple linear regression a ... [...More Info...] [...Related Items...] OR: [Wikipedia] [Google] [Baidu] |


