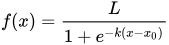
 Logistic functionA logistic function or logistic curve is a common S-shaped curve (sigmoid curve) with the equation f(x)=L1+e−k(x−x0){\displaystyle f(x)={\frac {L}{1+e^{-k(x-x_{0})}}}}where L{\displaystyle L} is the carrying capacity, the supremum of the values of the function;k{\displaystyle k} is the logistic growth rate, the steepness of the curve; andx0{\displaystyle x_{0}} is the x{\displaystyle x} value of the function's midpoint.The logistic function has domain the real numbers, the limit as x{\displaystyle x} tends to −∞{\displaystyle -\infty } is 0, and the limit as x{\displaystyle x} tends to +∞{\displaystyle +\infty } is L{\displaystyle L}.
 Logistic distributionIn probability theory and statistics, the logistic distribution is a continuous probability distribution. Its cumulative distribution function is the logistic function, which appears in logistic regression and feedforward neural networks. It resembles the normal distribution in shape but has heavier tails (higher kurtosis). The logistic distribution is a special case of the Tukey lambda distribution.
 ProbitIn statistics, the probit function converts a probability (a number between 0 and 1) into a score. This score indicates how many standard deviations a value from a standard normal distribution (or "bell curve") is from the mean. For example, a probability of 0.5 (50%) represents the exact middle of the distribution, so its probit score is 0. A smaller probability like 0.025 (2.5%) is far to the left on the curve, corresponding to a probit score of approximately −1.96.
 Inverse functionIn mathematics, the inverse function of a functionf (also called the inverse of f) is a function that undoes the operation of f. The inverse of f exists if and only iff is bijective, and if it exists, is denoted by f−1.{\displaystyle f^{-1}.}For a function f:X→Y{\displaystyle f\colon X\to Y}, its inverse f−1:Y→X{\displaystyle f^{-1}\colon Y\to X} admits an explicit description: it sends each element y∈Y{\displaystyle y\in Y} to the unique element x∈X{\displaystyle x\in X} such that f(x) = y. As an example, consider the real-valued function of a real variable given by f(x) = 5x − 7.
 ProbabilityProbability concerns events and numerical descriptions of how likely they are to occur. The probability of an event is a number between 0 and 1; the larger the probability, the more likely an event is to occur. This number is often expressed as a percentage (%), ranging from 0% to 100%. A simple example is the tossing of a fair (unbiased) coin.
 Data transformation (statistics)Application of a function to each point in a data set A scatterplot in which the areas of the sovereign states and dependent territories in the world are plotted on the vertical axis against their populations on the horizontal axis. The upper plot uses raw data. In the lower plot, both the area and population data have been transformed using the logarithm function.
 Quantile functionIn probability and statistics, the quantile function of a probability distribution is the inverse of its cumulative distribution function.
 LogarithmMathematical function, inverse of an exponential functionPlots of logarithm functions, with three commonly used bases. The special points logb b = 1 are indicated by dotted lines, and all curves intersect in logb 1 = 0.In mathematics, the logarithm of a number is the exponent by which another fixed value, the base, must be raised to produce that number. For example, the logarithm of 1000 to base 10 is 3, because 1000 is 10 to the 3rd power: 1000 = 10 = 10 × 10 × 10.
 OddsLook up in Wiktionary, the free dictionary.
 StatisticsStudy of collection and analysis of dataThe normal distribution, a very common probability density, is used extensively in inferential statistics.Scatter plots and line charts are used in descriptive statistics to show the observed relationships between different variables, here using the Iris flower data set.Statistics (from German: Statistik, orig.
 Machine learningSubset of artificial intelligenceMachine learning (ML) is a field of study in artificial intelligence concerned with the development and study of statistical algorithms that can learn from data and generalize to unseen data, and thus perform tasks without being explicitly programmed. Statistics and mathematical optimisation methods compose the foundations of machine learning.
 Data analysisData analysis is the process of inspecting, cleansing, transforming, and modelingdata with the goal of discovering useful information, informing conclusions, and supporting decision-making. Data analysis has multiple facets and approaches, encompassing diverse techniques under a variety of names, and is used in different business, science, and social science domains.
*As an Amazon Associate I earn from qualifying purchases.