|
Meteogram
A meteogram, also known as a meteorogram, is a graphical presentation of one or more meteorological variables with respect to time, whether observed or forecast, for a particular location. Where forecast data is used, the meteogram will typically be generated directly from a weather forecasting model based on the longitude, latitude and elevation of the location, but it can also be corrected by a meteorologist. Where a meteogram is used to display historical weather observations, this will typically be for a specific weather station. In the meteogram, time is plotted along the X axis, while the values of the different weather parameters are plotted along the Y axis. The most common weather parameters in a meteogram are precipitation, temperature, air pressure, cloud cover, wind speed and wind direction, such as ithis example meteogramprovided as part of a weather forecast by yr.no. In this example, wind speed and wind direction are conveniently presented in the form of , precip ... [...More Info...] [...Related Items...] OR: [Wikipedia] [Google] [Baidu] |
Cloud Cover
Cloud cover (also known as cloudiness, cloudage, or cloud amount) refers to the fraction of the sky obscured by clouds on average when observed from a particular location. Okta is the usual unit for measurement of the cloud cover. The cloud cover is correlated to the sunshine duration as the least cloudy locales are the sunniest ones while the cloudiest areas are the least sunny places, as clouds can block sunlight, especially at sunrise and sunset where sunlight is already limited. The global cloud cover averages around 67-68%, though it ranges from 56% to 73% depending on the minimum optical depth considered (lower when optical depth is large, and higher when it is low, such that subvisible cirrus clouds are counted). Average cloud cover is around 72% over the oceans, with low seasonal variation, and about 55% above land, with significant seasonal variation. Role in the climate system Clouds play multiple critical roles in the climate system and diurnal cycle. In ... [...More Info...] [...Related Items...] OR: [Wikipedia] [Google] [Baidu] |
WXP (software)
WXP, the Weather Processor, is a weather data manipulation and visualization package developed at Purdue University in the 1980s. In 1989, WXP was adopted by Unidata as the Unix-based weather analysis tool and was distributed to over 40 universities. WXP became a showcase venture for Unidata which at the time was promoting many of the new standards of software development and user interaction. In 1992, WXP was copyrighted and sold commercially through the Purdue Research Foundation. WXP version 4 became widely used in the university community to develop weather web site. The primary developer of WXP Dan Vietor developed the wxp.eas.purdue.edu web site which became one of the first weather web sites on the World Wide Web. With the move of the developer to Unisys in 1998, the rights to WXP were transferred to the Unisys Unisys Corporation is a global technology solutions company founded in 1986 and headquartered in Blue Bell, Pennsylvania. The company provides cloud, AI, di ... [...More Info...] [...Related Items...] OR: [Wikipedia] [Google] [Baidu] |
Barograph
A barograph is a barometer that records the barometric pressure over time in graphical form. This instrument is also used to make a continuous recording of atmospheric pressure. The pressure-sensitive element, a partially evacuated metal cylinder, is linked to a pen arm in such a way that the vertical displacement of the pen is proportional to the changes in the atmospheric pressure. Development Alexander Cumming, a watchmaker and mechanic, has a claim to having made the first effective recording barograph in the 1760s using an aneroid cell.Gloria Clifton (2004)"Cumming, Alexander (1731/2–1814)", ''Oxford Dictionary of National Biography'', Oxford University Press. (Subscription or UK public library membership required) Cumming created a series of barometrical clocks, including one for King George III George III (George William Frederick; 4 June 173829 January 1820) was King of Great Britain and King of Ireland, Ireland from 25 October 1760 until his death in 1820. Th ... [...More Info...] [...Related Items...] OR: [Wikipedia] [Google] [Baidu] |
William Playfair
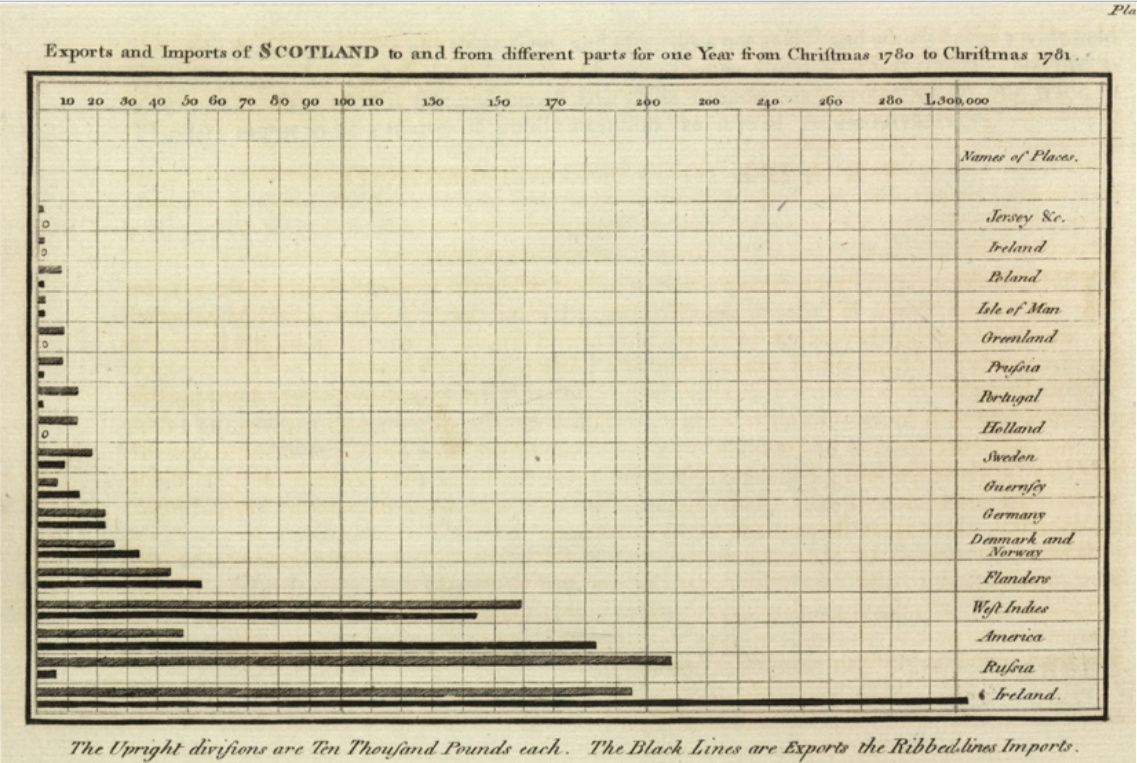
William Playfair (22 September 1759 – 11 February 1823) was a Scottish engineer and political economist. The founder of graphical methods of statistics, Playfair invented several types of diagrams: in 1786 he introduced the line, area and bar chart of economic data, and in 1801 he published what were likely the first pie chart and circle graph, used to show part-whole relations. Playfair has been reported to have been a secret agent for the British Government, although this is a subject of controversy. Biography William Playfair was born in 1759 in Scotland. He was the fourth son (named after his grandfather) of the Reverend James Playfair of the parish of Liff & Benvie near the city of Dundee in Scotland; his notable brothers were architect James Playfair and mathematician John Playfair. His father died in 1772 when he was 13, leaving the eldest brother John to care for the family and his education. After his apprenticeship with Andrew Meikle, the inventor of the thre ... [...More Info...] [...Related Items...] OR: [Wikipedia] [Google] [Baidu] |
Atmosphere
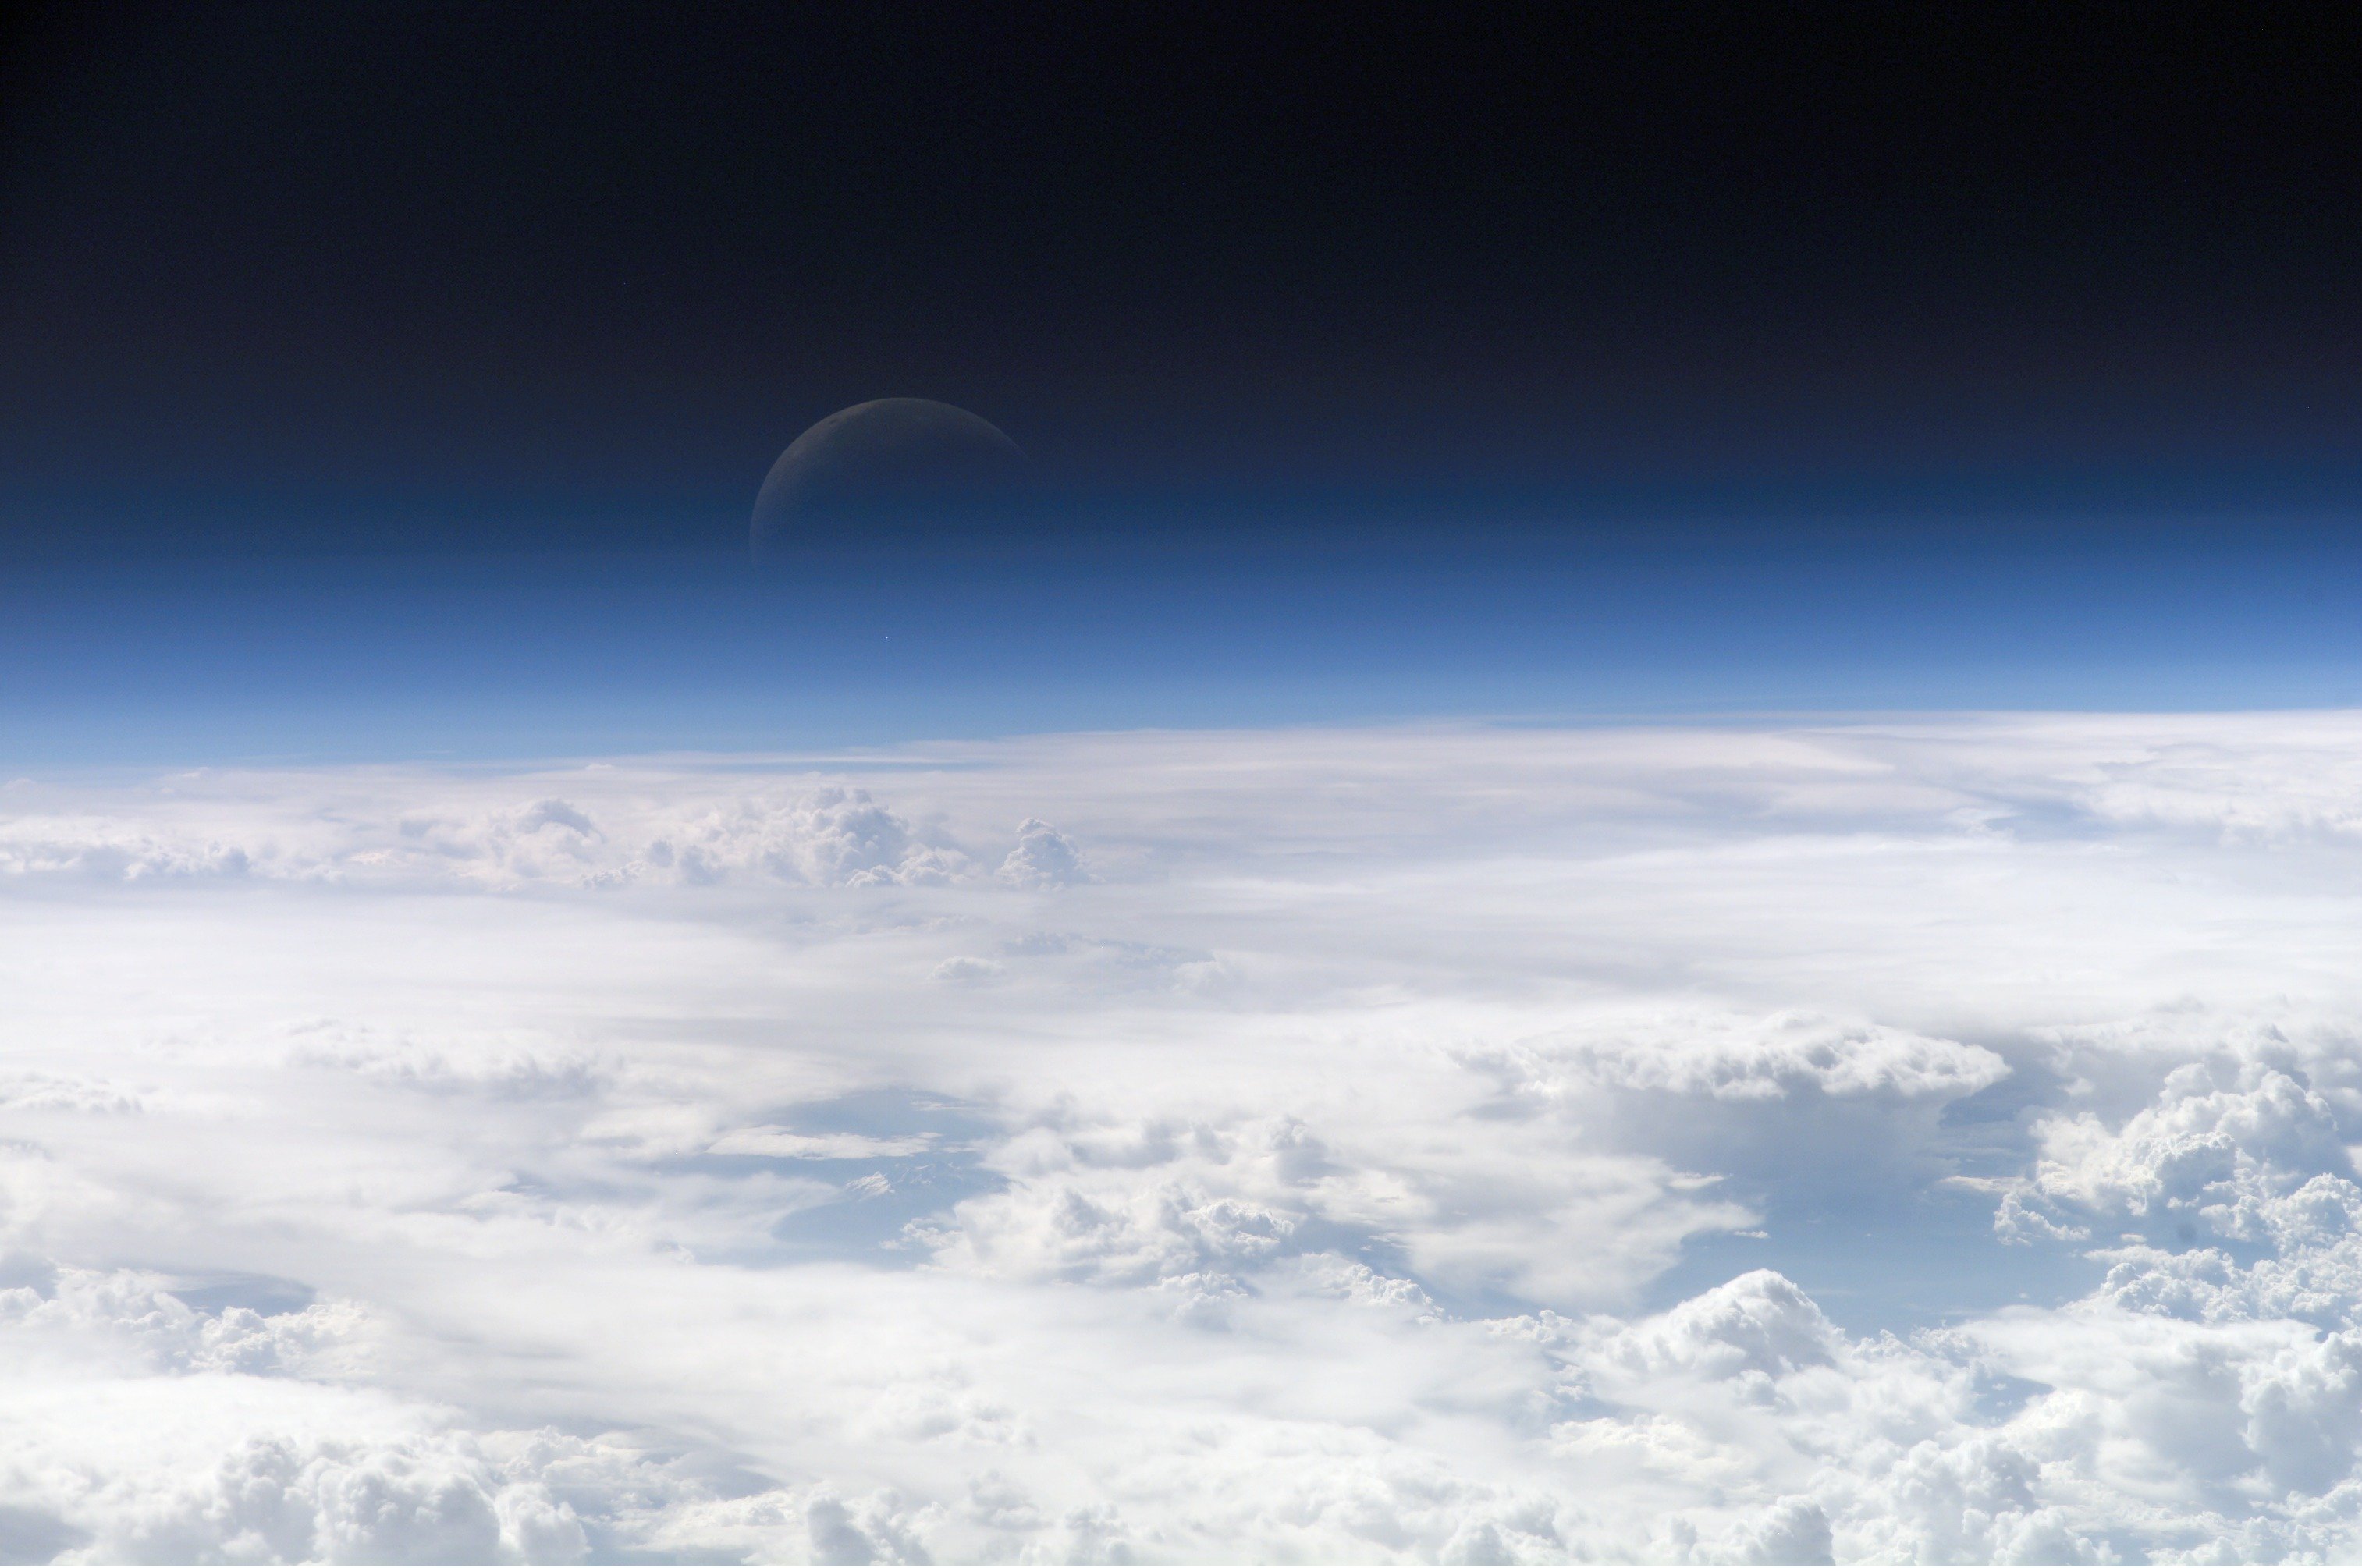
An atmosphere () is a layer of gases that envelop an astronomical object, held in place by the gravity of the object. A planet retains an atmosphere when the gravity is great and the temperature of the atmosphere is low. A stellar atmosphere is the outer region of a star, which includes the layers above the opaque photosphere; stars of low temperature might have outer atmospheres containing compound molecules. The atmosphere of Earth is composed of nitrogen (78%), oxygen (21%), argon (0.9%), carbon dioxide (0.04%) and trace gases. Most organisms use oxygen for respiration; lightning and bacteria perform nitrogen fixation which produces ammonia that is used to make nucleotides and amino acids; plants, algae, and cyanobacteria use carbon dioxide for photosynthesis. The layered composition of the atmosphere minimises the harmful effects of sunlight, ultraviolet radiation, solar wind, and cosmic rays and thus protects the organisms from genetic damage. The curr ... [...More Info...] [...Related Items...] OR: [Wikipedia] [Google] [Baidu] |
Cloud Cover
Cloud cover (also known as cloudiness, cloudage, or cloud amount) refers to the fraction of the sky obscured by clouds on average when observed from a particular location. Okta is the usual unit for measurement of the cloud cover. The cloud cover is correlated to the sunshine duration as the least cloudy locales are the sunniest ones while the cloudiest areas are the least sunny places, as clouds can block sunlight, especially at sunrise and sunset where sunlight is already limited. The global cloud cover averages around 67-68%, though it ranges from 56% to 73% depending on the minimum optical depth considered (lower when optical depth is large, and higher when it is low, such that subvisible cirrus clouds are counted). Average cloud cover is around 72% over the oceans, with low seasonal variation, and about 55% above land, with significant seasonal variation. Role in the climate system Clouds play multiple critical roles in the climate system and diurnal cycle. In ... [...More Info...] [...Related Items...] OR: [Wikipedia] [Google] [Baidu] |
Station Model
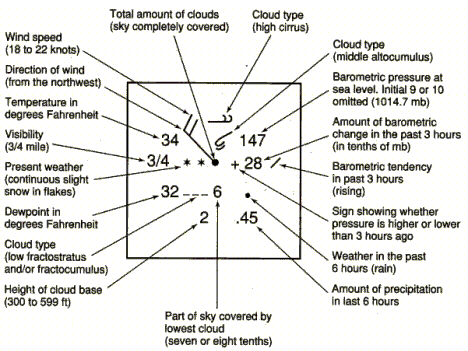
In meteorology, station models are symbolic illustrations showing the weather occurring at a given Weather station, reporting station. Meteorologists created the station model to fit a number of weather elements into a small space on weather maps. This allows map users to analyze patterns in atmospheric pressure, temperature, wind Wind speed, speed and Wind direction, direction, cloud cover, Precipitation (meteorology), precipitation, and other parameters. The most common station plots depict surface weather observations although upper air plots at various mandatory levels are also frequently depicted. Station model plots use an internationally accepted coding convention that has changed little since August 1, 1941. Elements in the plot show the key weather elements, including temperature, dew point, wind, cloud cover, air pressure, pressure tendency, and precipitation.Dr Elizabeth R. Tuttle (2005)Weather Maps. J. B. Calvert. Retrieved on 2007-05-10. Measurement location and units ... [...More Info...] [...Related Items...] OR: [Wikipedia] [Google] [Baidu] |
Wind Direction
Wind direction is generally reported by the direction from which the wind originates. For example, a ''north'' or ''northerly'' wind blows from the north to the south; the exceptions are onshore winds (blowing onto the shore from the water) and offshore winds (blowing off the shore to the water). Wind direction is usually reported in cardinal (or compass) direction, or in degrees. Consequently, a wind blowing from the north has a wind direction referred to as 0° (360°); a wind blowing from the east has a wind direction referred to as 90°, etc. Weather forecasts typically give the direction of the wind along with its speed, for example a "northerly wind at 15 km/h" is a wind blowing ''from'' the north at a speed of 15 km/h. If wind gusts are present, their speed may also be reported. Measurement techniques A variety of instruments can be used to measure wind direction, such as the anemoscope, windsock, and wind vane. All these instruments work by moving to minimize ... [...More Info...] [...Related Items...] OR: [Wikipedia] [Google] [Baidu] |
Wind Speed
In meteorology, wind speed, or wind flow speed, is a fundamental atmospheric quantity caused by air moving from high to low pressure, usually due to changes in temperature. Wind speed is now commonly measured with an anemometer. Wind speed affects weather forecasting, aviation and maritime operations, construction projects, growth and metabolism rates of many plant species, and has countless other implications. Wind direction is usually almost parallel to isobars (and not perpendicular, as one might expect), due to Earth's rotation. Units The meter per second (m/s) is the SI unit for velocity and the unit recommended by the World Meteorological Organization for reporting wind speeds, and used amongst others in weather forecasts in the Nordic countries. Since 2010 the International Civil Aviation Organization (ICAO) also recommends meters per second for reporting wind speed when approaching runways, replacing their former recommendation of using kilometers per hour ( ... [...More Info...] [...Related Items...] OR: [Wikipedia] [Google] [Baidu] |
Air Pressure
Atmospheric pressure, also known as air pressure or barometric pressure (after the barometer), is the pressure within the atmosphere of Earth. The Standard atmosphere (unit), standard atmosphere (symbol: atm) is a unit of pressure defined as , which is equivalent to 1,013.25 Bar (unit), millibars, 760millimetre of mercury, mm Hg, 29.9212inch of mercury, inchesHg, or 14.696pounds per square inch, psi.International Civil Aviation Organization. ''Manual of the International Standard Atmosphere, ICAO Standard Atmosphere'', Doc 7488-CD, Third Edition, 1993. . The atm unit is roughly equivalent to the mean sea-level atmospheric pressure on Earth; that is, the Earth's atmospheric pressure at sea level is approximately 1 atm. In most circumstances, atmospheric pressure is closely approximated by the fluid pressure, hydrostatic pressure caused by the weight of Earth's atmosphere, air above the measurement point. As elevation increases, there is less overlying atmospheric mass, so atmospher ... [...More Info...] [...Related Items...] OR: [Wikipedia] [Google] [Baidu] |
Weather Forecasting
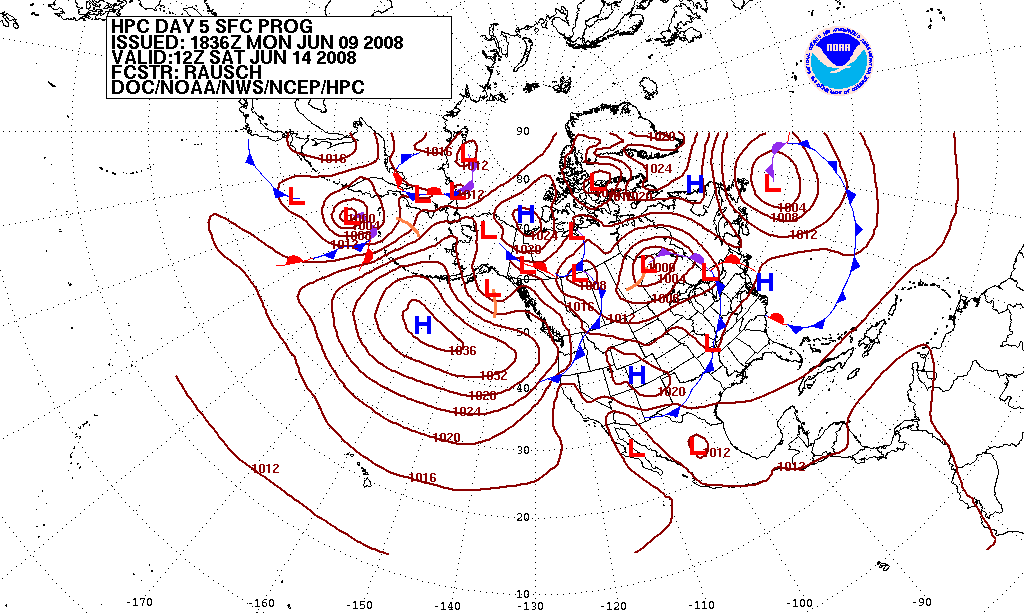
Weather forecasting or weather prediction is the application of science and technology forecasting, to predict the conditions of the Earth's atmosphere, atmosphere for a given location and time. People have attempted to predict the weather informally for thousands of years and formally since the 19th century. Weather forecasts are made by collecting quantitative data about the current state of the atmosphere, land, and ocean and using meteorology to project how the atmosphere will change at a given place. Once calculated manually based mainly upon changes in atmospheric pressure, barometric pressure, current weather conditions, and sky conditions or cloud cover, weather forecasting now relies on numerical weather prediction, computer-based models that take many atmospheric factors into account. Human input is still required to pick the best possible model to base the forecast upon, which involves pattern recognition skills, teleconnections, knowledge of model performance, and kn ... [...More Info...] [...Related Items...] OR: [Wikipedia] [Google] [Baidu] |


