|
First-order Second-moment Method
In probability theory, the first-order second-moment (FOSM) method, also referenced as mean value first-order second-moment (MVFOSM) method, is a probabilistic method to determine the stochastic moments of a function with random input variables. The name is based on the derivation, which uses a ''first-order'' Taylor series and the first and ''second moments'' of the input variables. Approximation Consider the objective function g(x), where the input vector x is a realization of the random vector X with probability density function f_X(x). Because X is randomly distributed, g is also randomly distributed. Following the FOSM method, the mean value of g is approximated by : \mu_g \approx g(\mu) The variance of g is approximated by : \sigma^2_g \approx \sum_^n \sum_^n \frac \frac \operatorname\left(X_i, X_j\right) where n is the length/dimension of x and \frac is the partial derivative of g at the mean vector \mu with respect to the ''i''-th entry of x. More accurate, second- ... [...More Info...] [...Related Items...] OR: [Wikipedia] [Google] [Baidu] |
Taylor Series
In mathematics, the Taylor series or Taylor expansion of a function is an infinite sum of terms that are expressed in terms of the function's derivatives at a single point. For most common functions, the function and the sum of its Taylor series are equal near this point. Taylor series are named after Brook Taylor, who introduced them in 1715. A Taylor series is also called a Maclaurin series, when 0 is the point where the derivatives are considered, after Colin Maclaurin, who made extensive use of this special case of Taylor series in the mid-18th century. The partial sum formed by the first terms of a Taylor series is a polynomial of degree that is called the th Taylor polynomial of the function. Taylor polynomials are approximations of a function, which become generally better as increases. Taylor's theorem gives quantitative estimates on the error introduced by the use of such approximations. If the Taylor series of a function is convergent, its sum is the limit of ... [...More Info...] [...Related Items...] OR: [Wikipedia] [Google] [Baidu] |
Probability Density Function
In probability theory, a probability density function (PDF), or density of a continuous random variable, is a function whose value at any given sample (or point) in the sample space (the set of possible values taken by the random variable) can be interpreted as providing a ''relative likelihood'' that the value of the random variable would be close to that sample. Probability density is the probability per unit length, in other words, while the ''absolute likelihood'' for a continuous random variable to take on any particular value is 0 (since there is an infinite set of possible values to begin with), the value of the PDF at two different samples can be used to infer, in any particular draw of the random variable, how much more likely it is that the random variable would be close to one sample compared to the other sample. In a more precise sense, the PDF is used to specify the probability of the random variable falling ''within a particular range of values'', as opposed ... [...More Info...] [...Related Items...] OR: [Wikipedia] [Google] [Baidu] |
Mean Value
There are several kinds of mean in mathematics, especially in statistics. Each mean serves to summarize a given group of data, often to better understand the overall value ( magnitude and sign) of a given data set. For a data set, the ''arithmetic mean'', also known as "arithmetic average", is a measure of central tendency of a finite set of numbers: specifically, the sum of the values divided by the number of values. The arithmetic mean of a set of numbers ''x''1, ''x''2, ..., x''n'' is typically denoted using an overhead bar, \bar. If the data set were based on a series of observations obtained by sampling from a statistical population, the arithmetic mean is the ''sample mean'' (\bar) to distinguish it from the mean, or expected value, of the underlying distribution, the ''population mean'' (denoted \mu or \mu_x).Underhill, L.G.; Bradfield d. (1998) ''Introstat'', Juta and Company Ltd.p. 181/ref> Outside probability and statistics, a wide range of other notions of mean a ... [...More Info...] [...Related Items...] OR: [Wikipedia] [Google] [Baidu] |
Variance
In probability theory and statistics, variance is the expectation of the squared deviation of a random variable from its population mean or sample mean. Variance is a measure of dispersion, meaning it is a measure of how far a set of numbers is spread out from their average value. Variance has a central role in statistics, where some ideas that use it include descriptive statistics, statistical inference, hypothesis testing, goodness of fit, and Monte Carlo sampling. Variance is an important tool in the sciences, where statistical analysis of data is common. The variance is the square of the standard deviation, the second central moment of a distribution, and the covariance of the random variable with itself, and it is often represented by \sigma^2, s^2, \operatorname(X), V(X), or \mathbb(X). An advantage of variance as a measure of dispersion is that it is more amenable to algebraic manipulation than other measures of dispersion such as the expected absolute deviatio ... [...More Info...] [...Related Items...] OR: [Wikipedia] [Google] [Baidu] |
Skewness
In probability theory and statistics, skewness is a measure of the asymmetry of the probability distribution of a real-valued random variable about its mean. The skewness value can be positive, zero, negative, or undefined. For a unimodal distribution, negative skew commonly indicates that the ''tail'' is on the left side of the distribution, and positive skew indicates that the tail is on the right. In cases where one tail is long but the other tail is fat, skewness does not obey a simple rule. For example, a zero value means that the tails on both sides of the mean balance out overall; this is the case for a symmetric distribution, but can also be true for an asymmetric distribution where one tail is long and thin, and the other is short but fat. Introduction Consider the two distributions in the figure just below. Within each graph, the values on the right side of the distribution taper differently from the values on the left side. These tapering sides are called ' ... [...More Info...] [...Related Items...] OR: [Wikipedia] [Google] [Baidu] |
Central Moment
In probability theory and statistics, a central moment is a moment of a probability distribution of a random variable about the random variable's mean; that is, it is the expected value of a specified integer power of the deviation of the random variable from the mean. The various moments form one set of values by which the properties of a probability distribution can be usefully characterized. Central moments are used in preference to ordinary moments, computed in terms of deviations from the mean instead of from zero, because the higher-order central moments relate only to the spread and shape of the distribution, rather than also to its location. Sets of central moments can be defined for both univariate and multivariate distributions. Univariate moments The ''n''th moment about the mean (or ''n''th central moment) of a real-valued random variable ''X'' is the quantity ''μ''''n'' := E continuous univariate">'X''''n'' where E is the expected value">expectation operator. For ... [...More Info...] [...Related Items...] OR: [Wikipedia] [Google] [Baidu] |
Monte Carlo Simulation
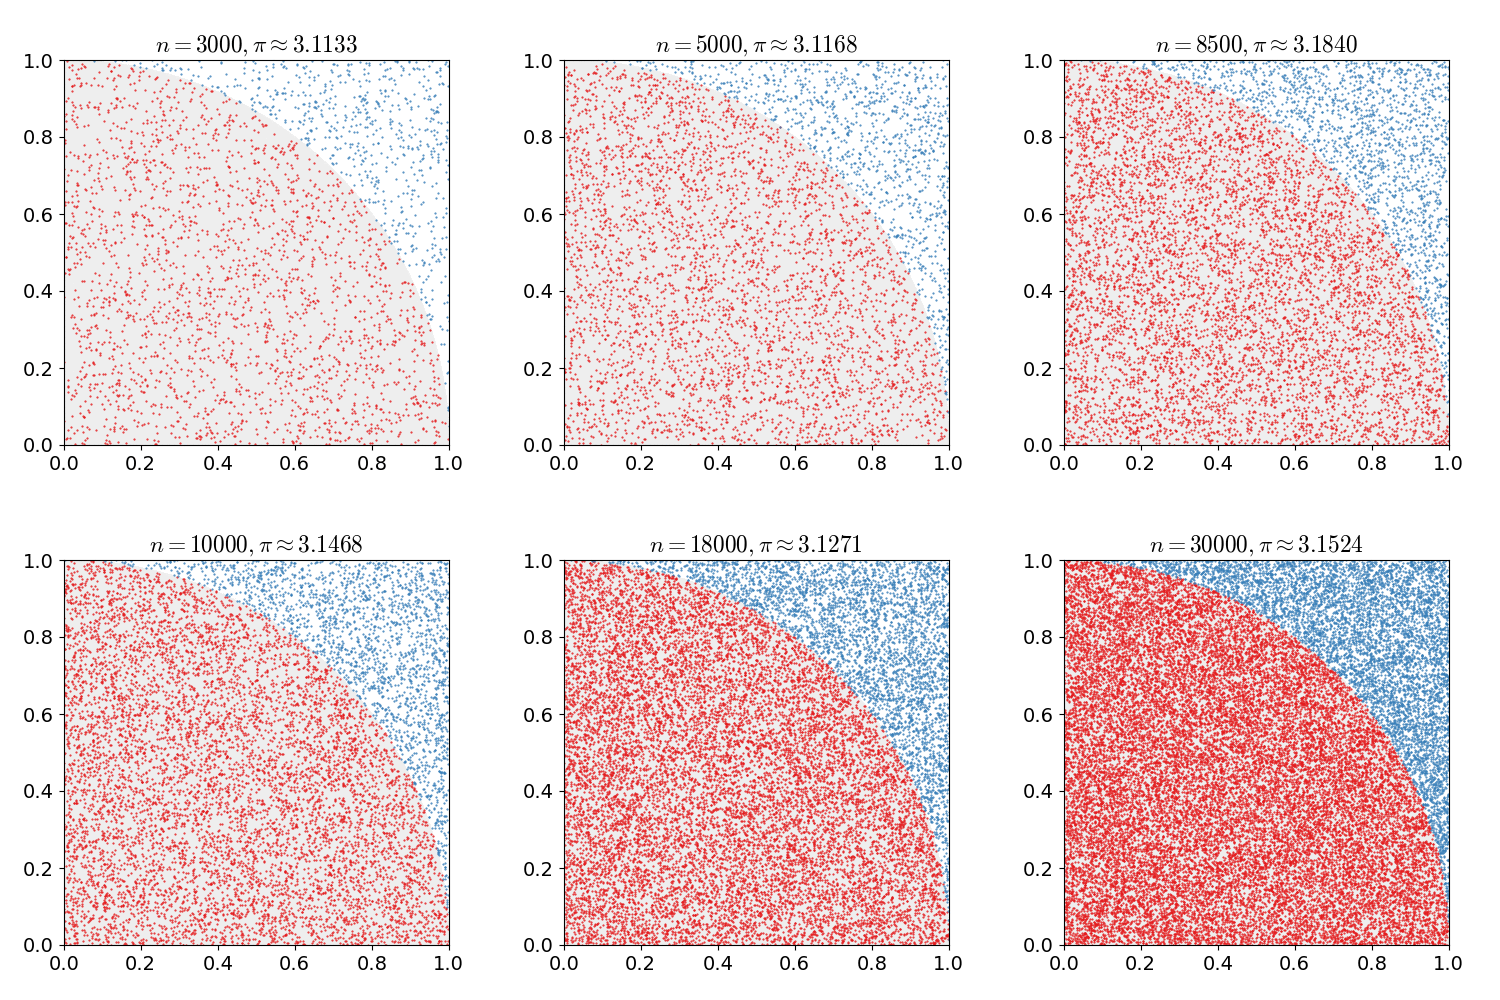
Monte Carlo methods, or Monte Carlo experiments, are a broad class of computational algorithms that rely on repeated random sampling to obtain numerical results. The underlying concept is to use randomness to solve problems that might be deterministic in principle. They are often used in physical and mathematical problems and are most useful when it is difficult or impossible to use other approaches. Monte Carlo methods are mainly used in three problem classes: optimization, numerical integration, and generating draws from a probability distribution. In physics-related problems, Monte Carlo methods are useful for simulating systems with many coupled degrees of freedom, such as fluids, disordered materials, strongly coupled solids, and cellular structures (see cellular Potts model, interacting particle systems, McKean–Vlasov processes, kinetic models of gases). Other examples include modeling phenomena with significant uncertainty in inputs such as the calculation of ris ... [...More Info...] [...Related Items...] OR: [Wikipedia] [Google] [Baidu] |
Finite Element Method
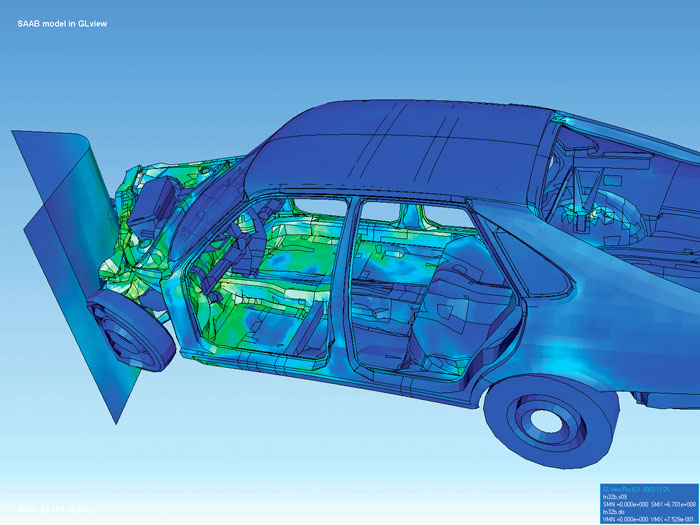
The finite element method (FEM) is a popular method for numerically solving differential equations arising in engineering and mathematical modeling. Typical problem areas of interest include the traditional fields of structural analysis, heat transfer, fluid flow, mass transport, and electromagnetic potential. The FEM is a general numerical method for solving partial differential equations in two or three space variables (i.e., some boundary value problems). To solve a problem, the FEM subdivides a large system into smaller, simpler parts that are called finite elements. This is achieved by a particular space discretization in the space dimensions, which is implemented by the construction of a mesh of the object: the numerical domain for the solution, which has a finite number of points. The finite element method formulation of a boundary value problem finally results in a system of algebraic equations. The method approximates the unknown function over the domain. The ... [...More Info...] [...Related Items...] OR: [Wikipedia] [Google] [Baidu] |
Finite Difference
A finite difference is a mathematical expression of the form . If a finite difference is divided by , one gets a difference quotient. The approximation of derivatives by finite differences plays a central role in finite difference methods for the numerical solution of differential equations, especially boundary value problems. The difference operator, commonly denoted \Delta is the operator that maps a function to the function \Delta /math> defined by :\Delta x)= f(x+1)-f(x). A difference equation is a functional equation that involves the finite difference operator in the same way as a differential equation involves derivatives. There are many similarities between difference equations and differential equations, specially in the solving methods. Certain recurrence relations can be written as difference equations by replacing iteration notation with finite differences. In numerical analysis, finite differences are widely used for approximating derivatives, and the term ... [...More Info...] [...Related Items...] OR: [Wikipedia] [Google] [Baidu] |
Probabilistic Models
Probability is the branch of mathematics concerning numerical descriptions of how likely an event is to occur, or how likely it is that a proposition is true. The probability of an event is a number between 0 and 1, where, roughly speaking, 0 indicates impossibility of the event and 1 indicates certainty."Kendall's Advanced Theory of Statistics, Volume 1: Distribution Theory", Alan Stuart and Keith Ord, 6th Ed, (2009), .William Feller, ''An Introduction to Probability Theory and Its Applications'', (Vol 1), 3rd Ed, (1968), Wiley, . The higher the probability of an event, the more likely it is that the event will occur. A simple example is the tossing of a fair (unbiased) coin. Since the coin is fair, the two outcomes ("heads" and "tails") are both equally probable; the probability of "heads" equals the probability of "tails"; and since no other outcomes are possible, the probability of either "heads" or "tails" is 1/2 (which could also be written as 0.5 or 50%). These conce ... [...More Info...] [...Related Items...] OR: [Wikipedia] [Google] [Baidu] |


