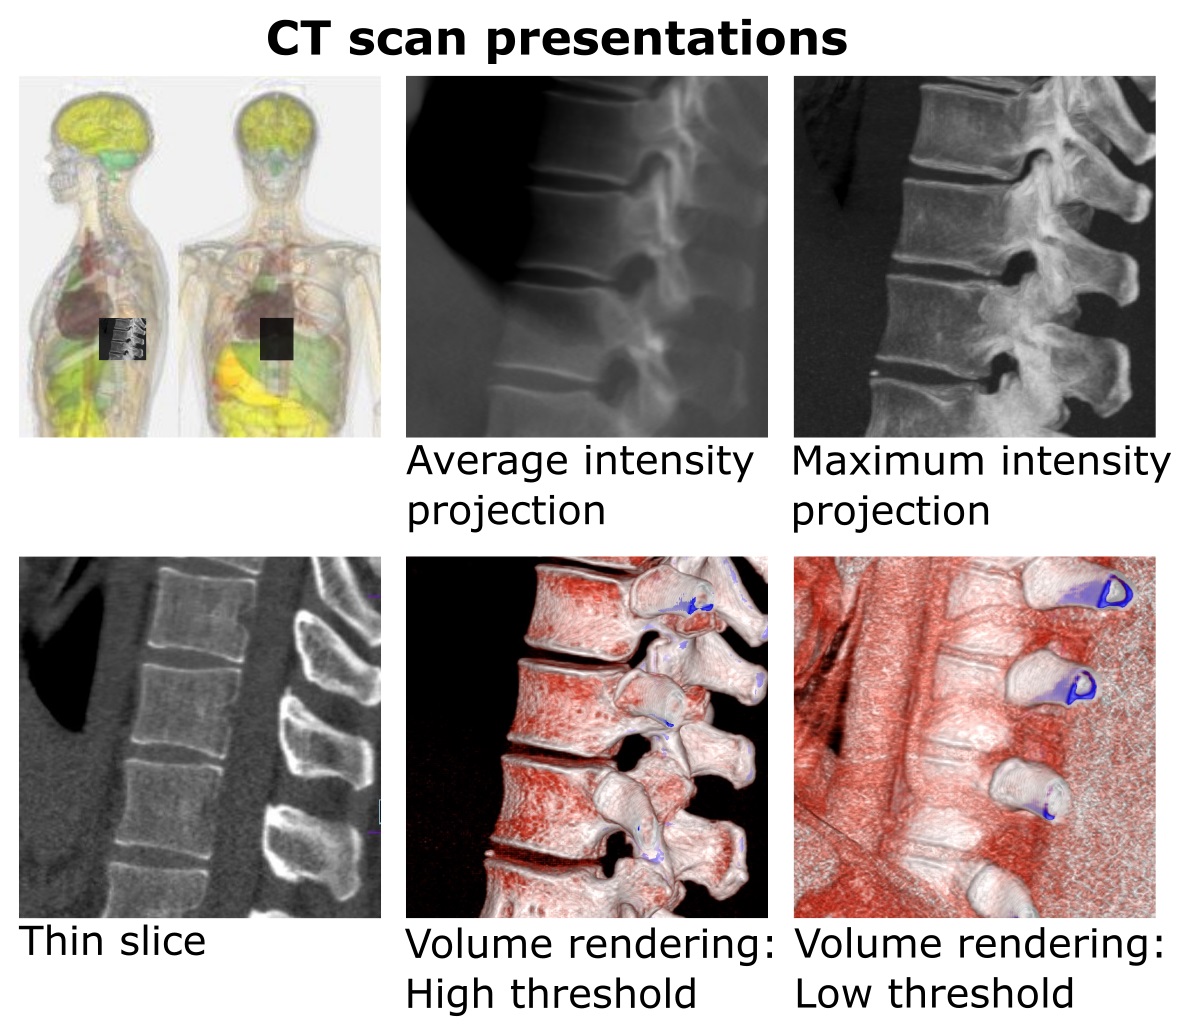
Maximum Intensity Projection on:
[Wikipedia]
[Google]
[Amazon]

 In
In

 In
In scientific visualization
Scientific visualization ( also spelled scientific visualisation) is an interdisciplinary branch of science concerned with the visualization of scientific phenomena.Michael Friendly (2008)"Milestones in the history of thematic cartography, stat ...
, a maximum intensity projection (MIP) is a method for 3D data that projects
A project is any undertaking, carried out individually or collaboratively and possibly involving research or design, that is carefully planned to achieve a particular goal.
An alternative view sees a project managerially as a sequence of even ...
in the visualization plane the voxel
In 3D computer graphics, a voxel represents a value on a regular grid in three-dimensional space. As with pixels in a 2D bitmap, voxels themselves do not typically have their position (i.e. coordinates) explicitly encoded with their values. Ins ...
s with maximum intensity that fall in the way of parallel rays traced from the viewpoint to the plane of projection. This implies that two MIP renderings from opposite viewpoints are symmetrical images if they are rendered using orthographic projection
Orthographic projection (also orthogonal projection and analemma) is a means of representing Three-dimensional space, three-dimensional objects in Two-dimensional space, two dimensions. Orthographic projection is a form of parallel projection in ...
.
MIP is used for the detection of lung nodules in lung cancer
Lung cancer, also known as lung carcinoma (since about 98–99% of all lung cancers are carcinomas), is a malignant lung tumor characterized by uncontrolled cell growth in tissue (biology), tissues of the lung. Lung carcinomas derive from tran ...
screening programs which use computed tomography scans. MIP enhances the 3D nature of these nodules, making them stand out from pulmonary bronchi and vasculature. MIP imaging is also used routinely by physicians in interpreting Positron Emission Tomography
Positron emission tomography (PET) is a functional imaging technique that uses radioactive substances known as radiotracers to visualize and measure changes in Metabolism, metabolic processes, and in other physiological activities including bl ...
(PET) or Magnetic Resonance Angiography
Magnetic resonance angiography (MRA) is a group of techniques based on magnetic resonance imaging (MRI) to image blood vessels. Magnetic resonance angiography is used to generate images of arteries (and less commonly veins) in order to evaluate ...
studies.
Additional techniques
This technique is computationally fast, but the 2D results do not provide a good sense of depth of the original data. To improve the sense of 3D, animations are usually rendered of several MIP frames in which the viewpoint is slightly changed from one to the other, thus creating the illusion ofrotation
Rotation, or spin, is the circular movement of an object around a '' central axis''. A two-dimensional rotating object has only one possible central axis and can rotate in either a clockwise or counterclockwise direction. A three-dimensional ...
. This helps the viewer's perception
Perception () is the organization, identification, and interpretation of sensory information in order to represent and understand the presented information or environment. All perception involves signals that go through the nervous system ...
to find the relative 3D positions of the object components. However, since the projection is orthographic the viewer cannot distinguish between left or right, front or back and even if the object is rotating clockwise or anti-clockwise. Use of depth weighting during production of rotating cines of MIP images can avoid the problem of difficulty of distinguishing right from left, and clockwise vs anti-clockwise rotation.
An easy improvement to MIP is Local maximum intensity projection In scientific visualization, a local maximum intensity projection (LMIP, Local MIP) or Closest Vessel Projection (CVP)
is a volume rendering method for 3D data, that is proposed as an improvement to the maximum intensity projection (MIP). Where th ...
. In this technique we don't take the global maximum
In mathematical analysis, the maxima and minima (the respective plurals of maximum and minimum) of a function, known collectively as extrema (the plural of extremum), are the largest and smallest value of the function, either within a given ra ...
value, but the first maximum value that is above a certain threshold. Because - in general - we can terminate the ray earlier this technique is faster and also gives somehow better results as it approximates occlusion.
History
MIP imaging was invented for use in Nuclear Medicine by Jerold Wallis, MD, in 1988 at Washington University in St Louis, and subsequently published in IEEE Transactions on Medical Imaging. In the setting of Nuclear Medicine, it was originally called MAP (Maximum Activity Projection).See also
*Minimum intensity projection
In scientific visualization, minimum intensity projection (MinIP) is a method for visualization of structures with low intensity in a specific volume. A two-dimensional image of a selected volume (for example all images that make up a 10 mm slab) ...
References
{{DEFAULTSORT:Maximum Intensity Projection Object visualization