Eadie–Hofstee diagram on:
[Wikipedia]
[Google]
[Amazon]
 In
In
 As the ordinate scale spans the entire range of theoretically possible vales, from to one can see at a glance at an Eadie–Hofstee plot how well the
 In
In biochemistry
Biochemistry, or biological chemistry, is the study of chemical processes within and relating to living organisms. A sub-discipline of both chemistry and biology, biochemistry may be divided into three fields: structural biology, enzymology, a ...
, an Eadie–Hofstee plot (or Eadie–Hofstee diagram) is a graphical representation of the Michaelis–Menten equation in enzyme kinetics
Enzyme kinetics is the study of the rates of enzyme catalysis, enzyme-catalysed chemical reactions. In enzyme kinetics, the reaction rate is measured and the effects of varying the conditions of the reaction are investigated. Studying an enzyme' ...
. It has been known by various different names, including Eadie plot, Hofstee plot and Augustinsson plot. Attribution to Woolf is often omitted, because although Haldane and Stern credited Woolf with the underlying equation, it was just one of the three linear transformations of the Michaelis–Menten equation that they initially introduced. However, Haldane indicated in 1957 that Woolf had indeed found the three linear forms:In 1932, Dr. Kurt Stern published a German translation of my book ''Enzymes'', with numerous additions to the English text. On pp. 119–120, I described some graphical methods, stating that they were due to my friend Dr. Barnett Woolf. ..Woolf pointed out that linear graphs are obtained when is plotted against , against , or against , the first plot being most convenient unless inhibition is being studied.
Derivation of the equation for the plot
The simplest equation for the rate of an enzyme-catalysed reaction as a function of the substrate concentration is the Michaelis-Menten equation, which can be written as follows: : in which is the rate at substrate saturation (when approaches infinity, or ''limiting rate'', and is the value of at half-saturation, i.e. for , known as the ''Michaelis constant''. Eadie and Hofstee transformed this into straight-line relationship. Multiplication of both sides by gives: : This can be directly rearranged to express a straight-line relationship: : which shows that a plot of against is a straight line with intercept on the ordinate, and slope (Hofstee plot). In the Eadie plot the axes are reversed: : with intercept on the ordinate, and slope . These plots are kinetic versions of the Scatchard plot used in ligand-binding experiments.Attribution to Augustinsson
The plot is occasionally attributed to Augustinsson and referred to the Woolf–Augustinsson–Hofstee plot or simply the Augustinsson plot. However, although Haldane, Woolf or Eadie were not explicitly cited when Augustinsson introduced the versus equation, both the work of Haldane and of Eadie are cited at other places of his work and are listed in his bibliography.Effect of experimental error
Experimental error is usually assumed to affect the rate and not the substrate concentration , so is thedependent variable
A variable is considered dependent if it depends on (or is hypothesized to depend on) an independent variable. Dependent variables are studied under the supposition or demand that they depend, by some law or rule (e.g., by a mathematical functio ...
. As a result, both ordinate and abscissa are subject to experimental error, and so the deviations that occur due to error are not parallel with the ordinate axis but towards or away from the origin. As long as the plot is used for ''illustrating'' an analysis rather than for ''estimating the parameters'', that matters very little. Regardless of these considerations various authors have compared the suitability of the various plots for displaying and analysing data.
Use for estimating parameters
Like other straight-line forms of the Michaelis–Menten equation, the Eadie–Hofstee plot was used historically for rapid evaluation of the parameters and , but has been largely superseded bynonlinear regression
In statistics, nonlinear regression is a form of regression analysis in which observational data are modeled by a function which is a nonlinear combination of the model parameters and depends on one or more independent variables. The data are fi ...
methods that are significantly more accurate when properly weighted and no longer computationally inaccessible.
Making faults in experimental design visible
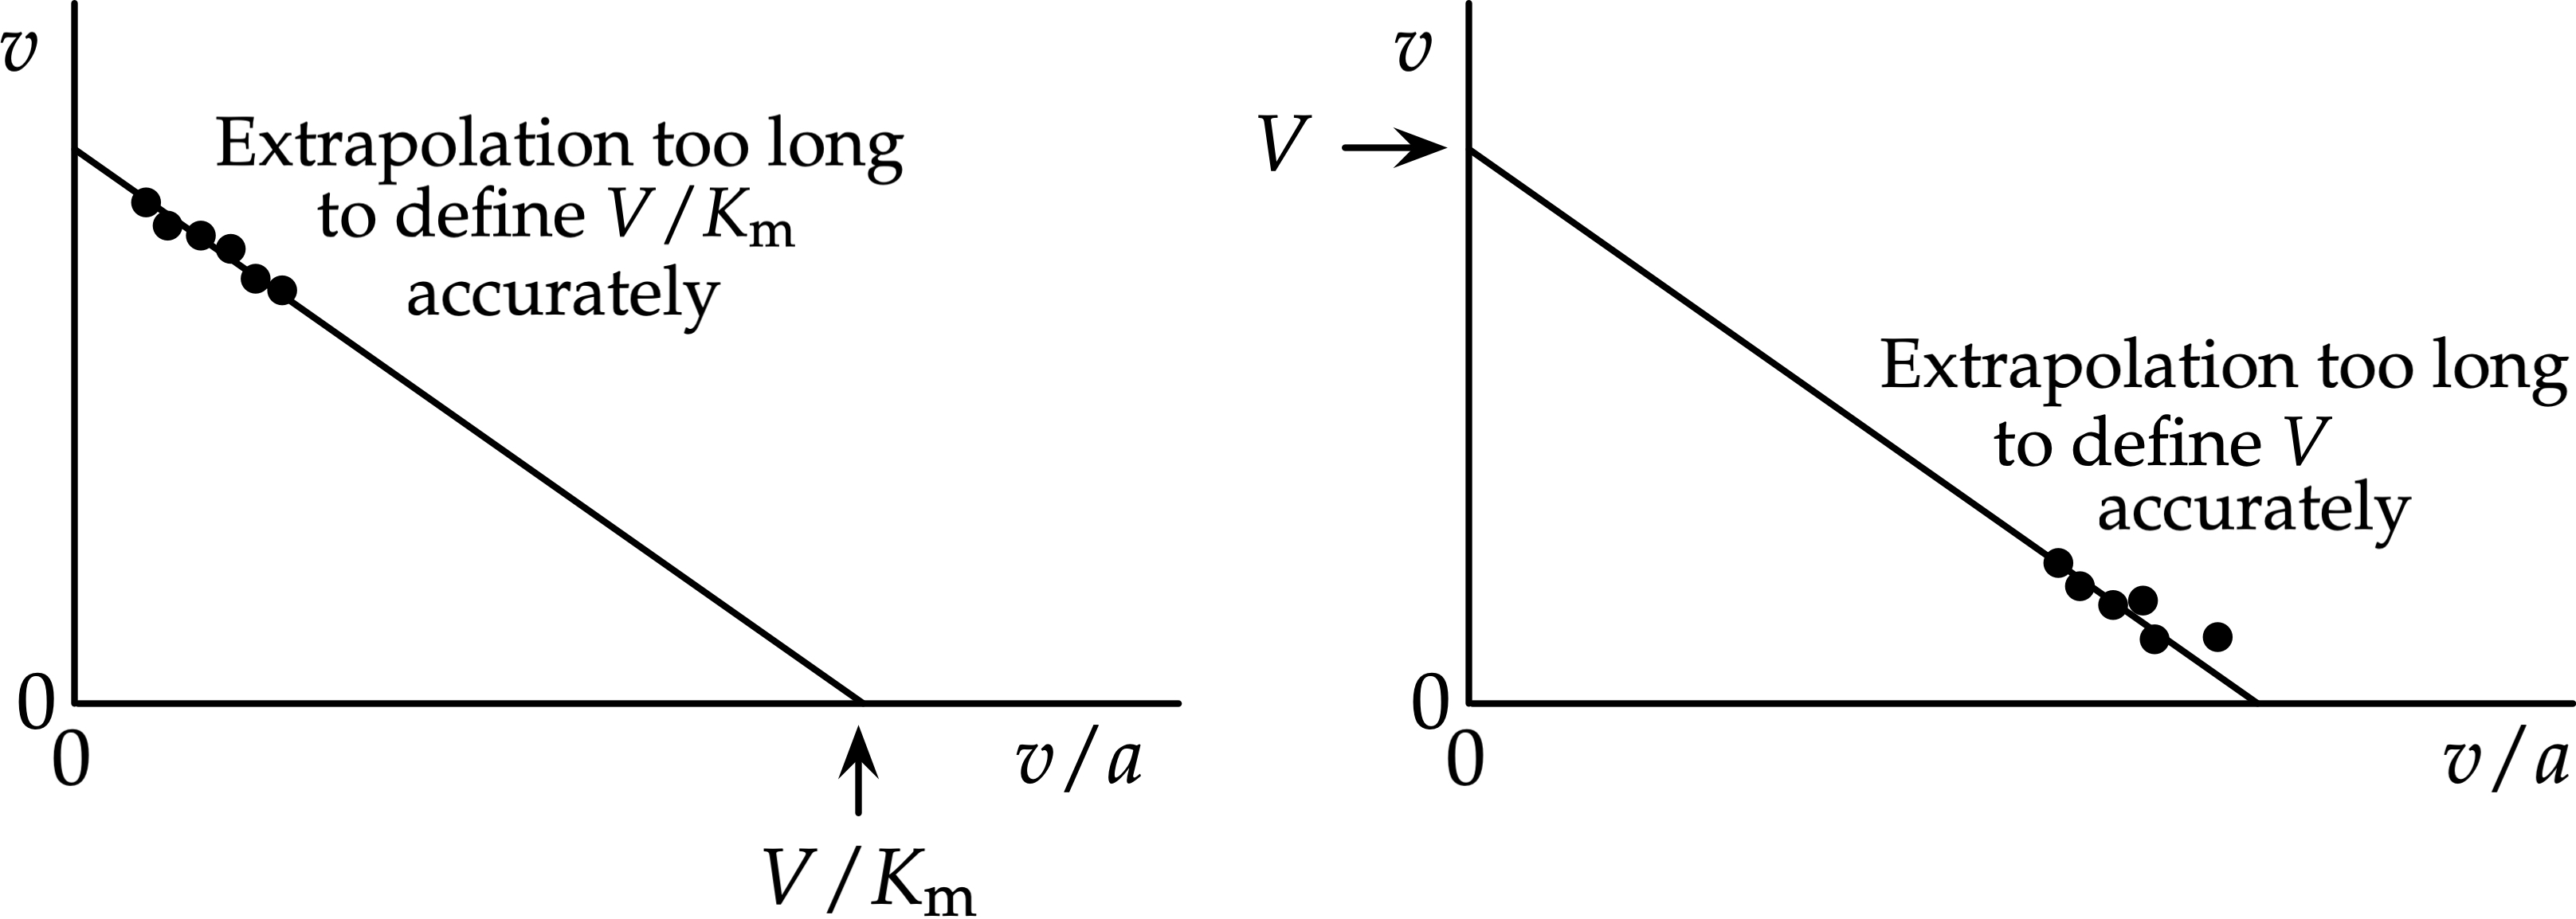
 As the ordinate scale spans the entire range of theoretically possible vales, from to one can see at a glance at an Eadie–Hofstee plot how well the
 experimental design
The design of experiments (DOE), also known as experiment design or experimental design, is the design of any task that aims to describe and explain the variation of information under conditions that are hypothesized to reflect the variation. ...
fills the theoretical design space, and the plot makes it impossible to hide poor design. By contrast, the other well known straight-line plots make it easy to choose scales that suggest that the design is better than it is. Faulty design, as shown in the right-hand diagram, is common with experiments with a substrate that is not soluble enough or too expensive to use concentrations above , and in this case cannot be estimated satisfactorily. The opposite case, with values concentrated above (left-hand diagram) is less common but not unknown, as for example in a study of nitrate reductase.
See also
*Michaelis–Menten kinetics
In biochemistry, Michaelis–Menten kinetics, named after Leonor Michaelis and Maud Menten, is the simplest case of enzyme kinetics, applied to enzyme-catalysed reactions involving the transformation of one substrate into one product. It takes th ...
* Lineweaver–Burk plot
* Hanes–Woolf plot
* Direct linear plot
Footnotes and references
{{DEFAULTSORT:Eadie-Hofstee diagram Diagrams Enzyme kinetics Biotechnology Molecular biology