Detection Error Tradeoff on:
[Wikipedia]
[Google]
[Amazon]

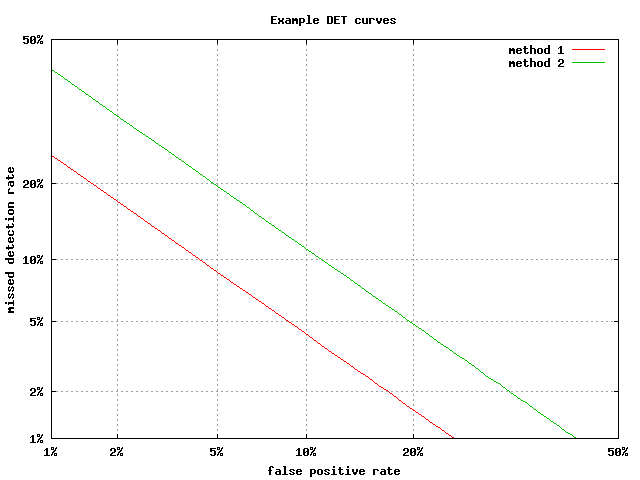
 A detection error tradeoff (DET) graph is a graphical plot of error rates for binary classification systems, plotting the false rejection rate vs. false acceptance rate.A. Martin, A., G. Doddington, T. Kamm, M. Ordowski, and M. Przybocki.
The DET Curve in Assessment of Detection Task Performance
, Proc. Eurospeech '97, Rhodes, Greece, September 1997, Vol. 4, pp. 1895-1898. The x- and y-axes are scaled non-linearly by their
standard normal deviate
A standard normal deviate is a normally distributed deviate. It is a realization of a standard normal random variable, defined as a random variable with expected value 0 and variance 1.Dodge, Y. (2003) The Oxford Dictionary of Statisti ...
s (or just by logarithmic transformation), yielding tradeoff curves that are more linear than ROC curves, and use most of the image area to highlight the differences of importance in the critical operating region.
Axis warping
The normal deviate mapping (or normal quantile function, or inverse normal cumulative distribution) is given by the probit function, so that the horizontal axis is ''x'' = probit(''Pfa'') and the vertical is ''y'' = probit(''Pfr''), where ''Pfa'' and ''Pfr'' are the false-accept and false-reject rates. The probit mapping maps probabilities from the unit interval ,1 to theextended real line
In mathematics, the affinely extended real number system is obtained from the real number system \R by adding two infinity elements: +\infty and -\infty, where the infinities are treated as actual numbers. It is useful in describing the algebra on ...
��∞, +∞ Since this makes the axes infinitely long, one has to confine the plot to some finite rectangle of interest.
See also
{{commons, Receiver operating characteristic, Receiver operating characteristic *Constant false alarm rate
Constant false alarm rate (CFAR) detection refers to a common form of adaptive algorithm used in radar systems to detect target returns against a background of noise, clutter and interference.
Principle
In the radar receiver, the returning ech ...
* Detection theory
Detection theory or signal detection theory is a means to measure the ability to differentiate between information-bearing patterns (called stimulus in living organisms, signal in machines) and random patterns that distract from the information ( ...
* False alarm
A false alarm, also called a nuisance alarm, is the deceptive or erroneous report of an emergency, causing unnecessary panic and/or bringing resources (such as emergency services) to a place where they are not needed. False alarms may occur with ...
* Receiver operating characteristic
A receiver operating characteristic curve, or ROC curve, is a graphical plot that illustrates the diagnostic ability of a binary classifier system as its discrimination threshold is varied. The method was originally developed for operators of m ...
References