|
Map Coloring
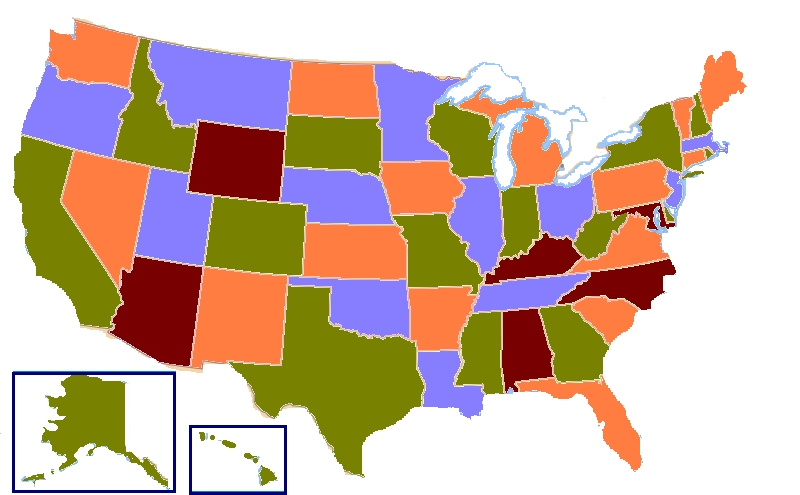
In cartography, map coloring is the act of choosing colors as a form of map symbol to be used on a map. In mathematics, map coloring is the act of assigning colors to features of a map such that no two adjacent features have the same color using the minimum number of colors. Cartography Color is a very useful attribute to depict different features on a map. Typical uses of color include displaying different political divisions, different elevations, or different kinds of roads. A choropleth map is a thematic map in which areas are colored differently to show the measurement of a statistical variable being displayed on the map. The choropleth map provides an easy way to visualize how a measurement varies across a geographic area or it shows the level of variability within a region. In addition to choropleth maps, a cartographer should strive to depict colors effectively on any kind of map. Displaying the data in different hues can greatly affect the understanding or feel of the ... [...More Info...] [...Related Items...] OR: [Wikipedia] [Google] [Baidu] |
Cartography
Cartography (; from grc, χάρτης , "papyrus, sheet of paper, map"; and , "write") is the study and practice of making and using maps. Combining science, aesthetics and technique, cartography builds on the premise that reality (or an imagined reality) can be modeled in ways that communicate spatial information effectively. The fundamental objectives of traditional cartography are to: * Set the map's agenda and select traits of the object to be mapped. This is the concern of map editing. Traits may be physical, such as roads or land masses, or may be abstract, such as toponyms or political boundaries. * Represent the terrain of the mapped object on flat media. This is the concern of map projections. * Eliminate characteristics of the mapped object that are not relevant to the map's purpose. This is the concern of generalization. * Reduce the complexity of the characteristics that will be mapped. This is also the concern of generalization. * Orchestrate the elements of the ... [...More Info...] [...Related Items...] OR: [Wikipedia] [Google] [Baidu] |
Map Symbol
A map symbol or cartographic symbol is a graphical device used to visually represent a real-world feature on a map, working in the same fashion as other forms of symbols. Map symbols may include point markers, lines, regions, continuous fields, or text; these can be designed visually in their shape, size, color, pattern, and other graphic variables to represent a variety of information about each phenomenon being represented. Map symbols simultaneously serve several purposes: * Declare the existence of geographic phenomena * Show location and extent * Visualize attribute information * Add to (or detract from) the aesthetic appeal of the map, and/or evoke a particular aesthetic reaction (a "look and feel") * Establish an overall gestalt order to make the map more or less useful, including visual hierarchy Representing spatial phenomena Symbols are used to represent geographic phenomena, which exist in, and are represented by, a variety of spatial forms. Different kinds of symbols ... [...More Info...] [...Related Items...] OR: [Wikipedia] [Google] [Baidu] |
Mathematics
Mathematics is an area of knowledge that includes the topics of numbers, formulas and related structures, shapes and the spaces in which they are contained, and quantities and their changes. These topics are represented in modern mathematics with the major subdisciplines of number theory, algebra, geometry, and analysis, respectively. There is no general consensus among mathematicians about a common definition for their academic discipline. Most mathematical activity involves the discovery of properties of abstract objects and the use of pure reason to prove them. These objects consist of either abstractions from nature orin modern mathematicsentities that are stipulated to have certain properties, called axioms. A ''proof'' consists of a succession of applications of deductive rules to already established results. These results include previously proved theorems, axioms, andin case of abstraction from naturesome basic properties that are considered true starting points of ... [...More Info...] [...Related Items...] OR: [Wikipedia] [Google] [Baidu] |
Map Of United States Vivid Colors Shown
A map is a symbolic depiction emphasizing relationships between elements of some space, such as objects, regions, or themes. Many maps are static, fixed to paper or some other durable medium, while others are dynamic or interactive. Although most commonly used to depict geography, maps may represent any space, real or fictional, without regard to context or scale, such as in brain mapping, DNA mapping, or computer network topology mapping. The space being mapped may be two dimensional, such as the surface of the earth, three dimensional, such as the interior of the earth, or even more abstract spaces of any dimension, such as arise in modeling phenomena having many independent variables. Although the earliest maps known are of the heavens, geographic maps of territory have a very long tradition and exist from ancient times. The word "map" comes from the , wherein ''mappa'' meant 'napkin' or 'cloth' and ''mundi'' 'the world'. Thus, "map" became a shortened term referring to ... [...More Info...] [...Related Items...] OR: [Wikipedia] [Google] [Baidu] |
2004US Election Map
4US is an Australian community radio station located in Rockhampton, Queensland. The station is managed by the Central Queensland Aboriginal Corporation for Media and broadcasts programming specifically aimed at Central Queensland's Aboriginal community on 100.7 FM. 4US first went to air in 1998 with programs originating from an outside broadcast van that had been donated to the station by ABC Capricornia, before the station established a better equipped studio in the heritage-listed Rockhampton Harbour Board Building. In 2005, the station moved to a new studio at the Dreamtime Cultural Centre in North Rockhampton, where it continues to broadcast from. In the past, 4US announcers have attended training sessions at Brisbane indigenous radio station, 98.9 FM where 4US staff worked with experienced radio broadcasters including industry veteran Jamie Dunn. [...More Info...] [...Related Items...] OR: [Wikipedia] [Google] [Baidu] |
Easter Island Map-en
Easter,Traditional names for the feast in English are "Easter Day", as in the ''Book of Common Prayer''; "Easter Sunday", used by James Ussher''The Whole Works of the Most Rev. James Ussher, Volume 4'') and Samuel Pepys''The Diary of Samuel Pepys, Volume 2'') as well as the single word "Easter" in books printed i157515841586 also called Pascha (Aramaic, Greek, Latin) or Resurrection Sunday, is a Christian festival and cultural holiday commemorating the resurrection of Jesus from the dead, described in the New Testament as having occurred on the third day of his burial following his crucifixion by the Romans at Calvary . It is the culmination of the Passion of Jesus Christ, preceded by Lent (or Great Lent), a 40-day period of fasting, prayer, and penance. Easter-observing Christians commonly refer to the week before Easter as Holy Week, which in Western Christianity begins on Palm Sunday (marking the entrance of Jesus in Jerusalem), includes Spy Wednesday (on which the betr ... [...More Info...] [...Related Items...] OR: [Wikipedia] [Google] [Baidu] |
Choropleth Map
A choropleth map () is a type of statistical thematic map that uses pseudocolor, i.e., color corresponding with an aggregate summary of a geographic characteristic within spatial enumeration units, such as population density or per-capita income. Choropleth maps provide an easy way to visualize how a variable varies across a geographic area or show the level of variability within a region. A heat map or isarithmic map is similar but uses regions drawn according to the pattern of the variable, rather than the ''a priori'' geographic areas of choropleth maps. The choropleth is likely the most common type of thematic map because published statistical data (from government or other sources) is generally aggregated into well-known geographic units, such as countries, states, provinces, and counties, and thus they are relatively easy to create using GIS, spreadsheets, or other software tools. History The earliest known choropleth map was created in 1826 by Baron Pierre Charles D ... [...More Info...] [...Related Items...] OR: [Wikipedia] [Google] [Baidu] |
Color Symbolism
Color symbolism in art and anthropology refers to the use of color as a symbol in various cultures. There is great diversity in the use of colors and their associations between cultures and even within the same culture in different time periods. The same color may have very different associations within the same culture at any time. Diversity in color symbolism occurs because color meanings and symbolism occur on an individual, cultural and universal basis. Color symbolism is also context-dependent and influenced by changes over time. Symbolic representations of religious concepts or articles may include a specific color with which the concept or object is associated. There is evidence to suggest that colors have been used for this purpose as early as 90,000 BC. Common associations Red Red is a primary color across all models of color space. It is often associated with love, passion, and lust but also danger. It is frequently used in relation to Valentine's Day. It can also ... [...More Info...] [...Related Items...] OR: [Wikipedia] [Google] [Baidu] |
Color Blindness
Color blindness or color vision deficiency (CVD) is the decreased ability to color vision, see color or differences in color. It can impair tasks such as selecting ripe fruit, choosing clothing, and reading traffic lights. Color blindness may make some academic activities more difficult. However, issues are generally minor, and the colorblind automatically develop adaptations and coping mechanisms. People with achromatopsia, total color blindness (achromatopsia) may also be Hemeralopia, uncomfortable in bright environments and have visual impairment, decreased visual acuity. The most common cause of color blindness is an Heredity, inherited problem or variation in the functionality of one or more of the three classes of cone cells in the retina, which mediate color vision. The most common form is caused by a genetic disorder called congenital red–green color blindness. Males are more likely to be color blind than females, because the genes responsible for the most common for ... [...More Info...] [...Related Items...] OR: [Wikipedia] [Google] [Baidu] |
Geographic Information System
A geographic information system (GIS) is a type of database containing Geographic data and information, geographic data (that is, descriptions of phenomena for which location is relevant), combined with Geographic information system software, software tools for managing, Spatial analysis, analyzing, and Cartographic design, visualizing those data. In a broader sense, one may consider such a system to also include human users and support staff, procedures and workflows, body of knowledge of relevant concepts and methods, and institutional organizations. The uncounted plural, ''geographic information systems'', also abbreviated GIS, is the most common term for the industry and profession concerned with these systems. It is roughly synonymous with geoinformatics and part of the broader geospatial field, which also includes GPS, remote sensing, etc. Geographic information science, the academic discipline that studies these systems and their underlying geographic principles, may also ... [...More Info...] [...Related Items...] OR: [Wikipedia] [Google] [Baidu] |
Color Scheme
In color theory, a color scheme is the choice of colors used in various artistic and design contexts. For example, the "Achromatic" use of a white background with black text is an example of a basic and commonly default color scheme in web design. Color schemes are used to create style and appeal. Colors that create an aesthetic feeling when used together will commonly accompany each other in color schemes. A basic color scheme will use two colors that look appealing together. More advanced color schemes involve several related colors in "Analogous" combination, for example, text with such colors as red, yellow, and orange arranged together on a black background in a magazine article. The addition of light blue creates an "Accented Analogous" color scheme. Use of the phrase ''color scheme'' may also and commonly does refer to choice and use of colors used outside typical aesthetic media and context, although may still be used for purely aesthetic effect as well as for purely ... [...More Info...] [...Related Items...] OR: [Wikipedia] [Google] [Baidu] |
Anaglyph 3D
Anaglyph 3D is the stereoscopic 3D effect achieved by means of encoding each eye's image using filters of different (usually chromatically opposite) colors, typically red and cyan. Anaglyph 3D images contain two differently filtered colored images, one for each eye. When viewed through the "color-coded" "anaglyph glasses", each of the two images reaches the eye it's intended for, revealing an integrated stereoscopic image. The visual cortex of the brain fuses this into the perception of a three-dimensional scene or composition. Anaglyph images have seen a recent resurgence due to the presentation of images and video on the Web, Blu-ray Discs, CDs, and even in print. Low cost paper frames or plastic-framed glasses hold accurate color filters that typically, after 2002, make use of all 3 primary colors. The current norm is red and cyan, with red being used for the left channel. The cheaper filter material used in the monochromatic past dictated red and blue for convenience and ... [...More Info...] [...Related Items...] OR: [Wikipedia] [Google] [Baidu] |


.png)


.jpg)