|
Blobbogram
A forest plot, also known as a blobbogram, is a graphical display of estimated results from a number of scientific studies addressing the same question, along with the overall results. It was developed for use in medical research as a means of graphically representing a meta-analysis of the results of randomized controlled trials. In the last twenty years, similar meta-analytical techniques have been applied in observational studies (e.g. environmental epidemiology) and forest plots are often used in presenting the results of such studies also. Although forest plots can take several forms, they are commonly presented with two columns. The left-hand column lists the names of the studies (frequently randomized controlled trials or epidemiological studies), commonly in chronological order from the top downwards. The right-hand column is a plot of the measure of effect (''e.g.'' an odds ratio) for each of these studies (often represented by a square) incorporating confidence interva ... [...More Info...] [...Related Items...] OR: [Wikipedia] [Google] [Baidu] |
Further Research Is Needed
The phrases "further research is needed" (FRIN), "more research is needed" and other variants are commonly used in research papers. The cliché is so common that it has attracted research, regulation and cultural commentary. Meaning Some research journals have banned the phrase "more research is needed" on the grounds that it is redundant; it is almost always true and fits almost any article, and so can be taken as understood. A 2004 metareview by the Cochrane collaboration of their own systematic medical reviews found that 93% of the reviews studied made indiscriminate FRIN-like statements, reducing their ability to guide future research. The presence of FRIN had no correlation with the strength of the evidence against the medical intervention. Authors who thought a treatment was useless were just as likely to recommend researching it further. Indeed, authors may recommend "further research" when, given the existing evidence, further research would be extremely unlikely to ... [...More Info...] [...Related Items...] OR: [Wikipedia] [Google] [Baidu] |
Systematic Review
A systematic review is a scholarly synthesis of the evidence on a clearly presented topic using critical methods to identify, define and assess research on the topic. A systematic review extracts and interprets data from published studies on the topic, then analyzes, describes, and summarizes interpretations into a refined conclusion. For example, a systematic review of randomized controlled trials is a way of summarizing and implementing evidence-based medicine. While a systematic review may be applied in the biomedical or health care context, it may also be used where an assessment of a precisely defined subject can advance understanding in a field of research. A systematic review may examine clinical tests, public health interventions, environmental interventions, social interventions, adverse effects, qualitative evidence syntheses, methodological reviews, policy reviews, and economic evaluations. An understanding of systematic reviews and how to implement them in prac ... [...More Info...] [...Related Items...] OR: [Wikipedia] [Google] [Baidu] |
Preterm Birth
Preterm birth, also known as premature birth, is the birth of a baby at fewer than 37 weeks gestational age, as opposed to full-term delivery at approximately 40 weeks. Extreme preterm is less than 28 weeks, very early preterm birth is between 28 and 32 weeks, early preterm birth occurs between 32 and 36 weeks, late preterm birth is between 34 and 36 weeks' gestation. These babies are also known as premature babies or colloquially preemies (American English) or premmies (Australian English). Symptoms of preterm labor include uterine contractions which occur more often than every ten minutes and/or the leaking of fluid from the vagina before 37 weeks. Premature infants are at greater risk for cerebral palsy, delays in development, hearing problems and problems with their vision. The earlier a baby is born, the greater these risks will be. The cause of spontaneous preterm birth is often not known. Risk factors include diabetes, high blood pressure, multiple gestation (bei ... [...More Info...] [...Related Items...] OR: [Wikipedia] [Google] [Baidu] |
Cochrane (organisation)
Cochrane (previously known as the Cochrane Collaboration) is a British international charitable organisation formed to organise medical research findings to facilitate evidence-based choices about health interventions involving health professionals, patients and policy makers. It includes 53 review groups that are based at research institutions worldwide. Cochrane has approximately 30,000 volunteer experts from around the world. The group conducts systematic reviews of health-care interventions and diagnostic tests and publishes them in the Cochrane Library. According to the Library, articles are available via one-click access, but some require paid subscription or registration before reading. A few reviews, in occupational health for example, incorporate results from non-randomised observational studies as well as controlled before–after (CBA) studies and interrupted time-series studies. History Cochrane, previously known as the Cochrane Collaboration, was founded i ... [...More Info...] [...Related Items...] OR: [Wikipedia] [Google] [Baidu] |
Funnel Plot
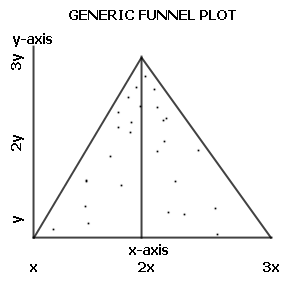
A funnel plot is a graph designed to check for the existence of publication bias; funnel plots are commonly used in systematic reviews and meta-analyses. In the absence of publication bias, it assumes that studies with high precision will be plotted near the average, and studies with low precision will be spread evenly on both sides of the average, creating a roughly funnel-shaped distribution. Deviation from this shape can indicate publication bias. Quotation Funnel plots, introduced by Light and Pillemer in 1984 and discussed in detail by Matthias Egger and colleagues, are useful adjuncts to meta-analyses. A funnel plot is a scatterplot of treatment effect against a measure of study precision. It is used primarily as a visual aid for detecting bias or systematic heterogeneity. A symmetric inverted funnel shape arises from a ‘well-behaved’ data set, in which publication bias is unlikely. An asymmetric funnel indicates a relationship between treatment effect estimate and stu ... [...More Info...] [...Related Items...] OR: [Wikipedia] [Google] [Baidu] |
Galbraith Plot
In statistics, a Galbraith plot (also known as Galbraith's radial plot or just radial plot) is one way of displaying several estimates of the same quantity that have different standard errors. It can be used to examine heterogeneity in a meta-analysis, as an alternative or supplement to a forest plot. A Galbraith plot is produced by first calculating the standardized estimates or ''z''-statistics by dividing each estimate by its standard error (SE). The Galbraith plot is then a scatter plot of each ''z''-statistic (vertical axis) against 1/SE (horizontal axis). Larger studies (with smaller SE and larger 1/SE) will be observed to aggregate away from the origin. See also * Plot * Funnel plot A funnel plot is a graph designed to check for the existence of publication bias; funnel plots are commonly used in systematic reviews and meta-analyses. In the absence of publication bias, it assumes that studies with high precision will be plotte ... References External links *Galbrai ... [...More Info...] [...Related Items...] OR: [Wikipedia] [Google] [Baidu] |
Homogeneity (statistics)
In statistics, homogeneity and its opposite, heterogeneity, arise in describing the properties of a dataset, or several datasets. They relate to the validity of the often convenient assumption that the statistical properties of any one part of an overall dataset are the same as any other part. In meta-analysis, which combines the data from several studies, homogeneity measures the differences or similarities between the several studies (see also Study heterogeneity). Homogeneity can be studied to several degrees of complexity. For example, considerations of homoscedasticity examine how much the variability of data-values changes throughout a dataset. However, questions of homogeneity apply to all aspects of the statistical distributions, including the location parameter. Thus, a more detailed study would examine changes to the whole of the marginal distribution. An intermediate-level study might move from looking at the variability to studying changes in the skewness. In additi ... [...More Info...] [...Related Items...] OR: [Wikipedia] [Google] [Baidu] |
Sample Size Determination
Sample size determination is the act of choosing the number of observations or replicates to include in a statistical sample. The sample size is an important feature of any empirical study in which the goal is to make inferences about a population from a sample. In practice, the sample size used in a study is usually determined based on the cost, time, or convenience of collecting the data, and the need for it to offer sufficient statistical power. In complicated studies there may be several different sample sizes: for example, in a stratified survey there would be different sizes for each stratum. In a census, data is sought for an entire population, hence the intended sample size is equal to the population. In experimental design, where a study may be divided into different treatment groups, there may be different sample sizes for each group. Sample sizes may be chosen in several ways: *using experience – small samples, though sometimes unavoidable, can result in wide confid ... [...More Info...] [...Related Items...] OR: [Wikipedia] [Google] [Baidu] |
Statistical Power
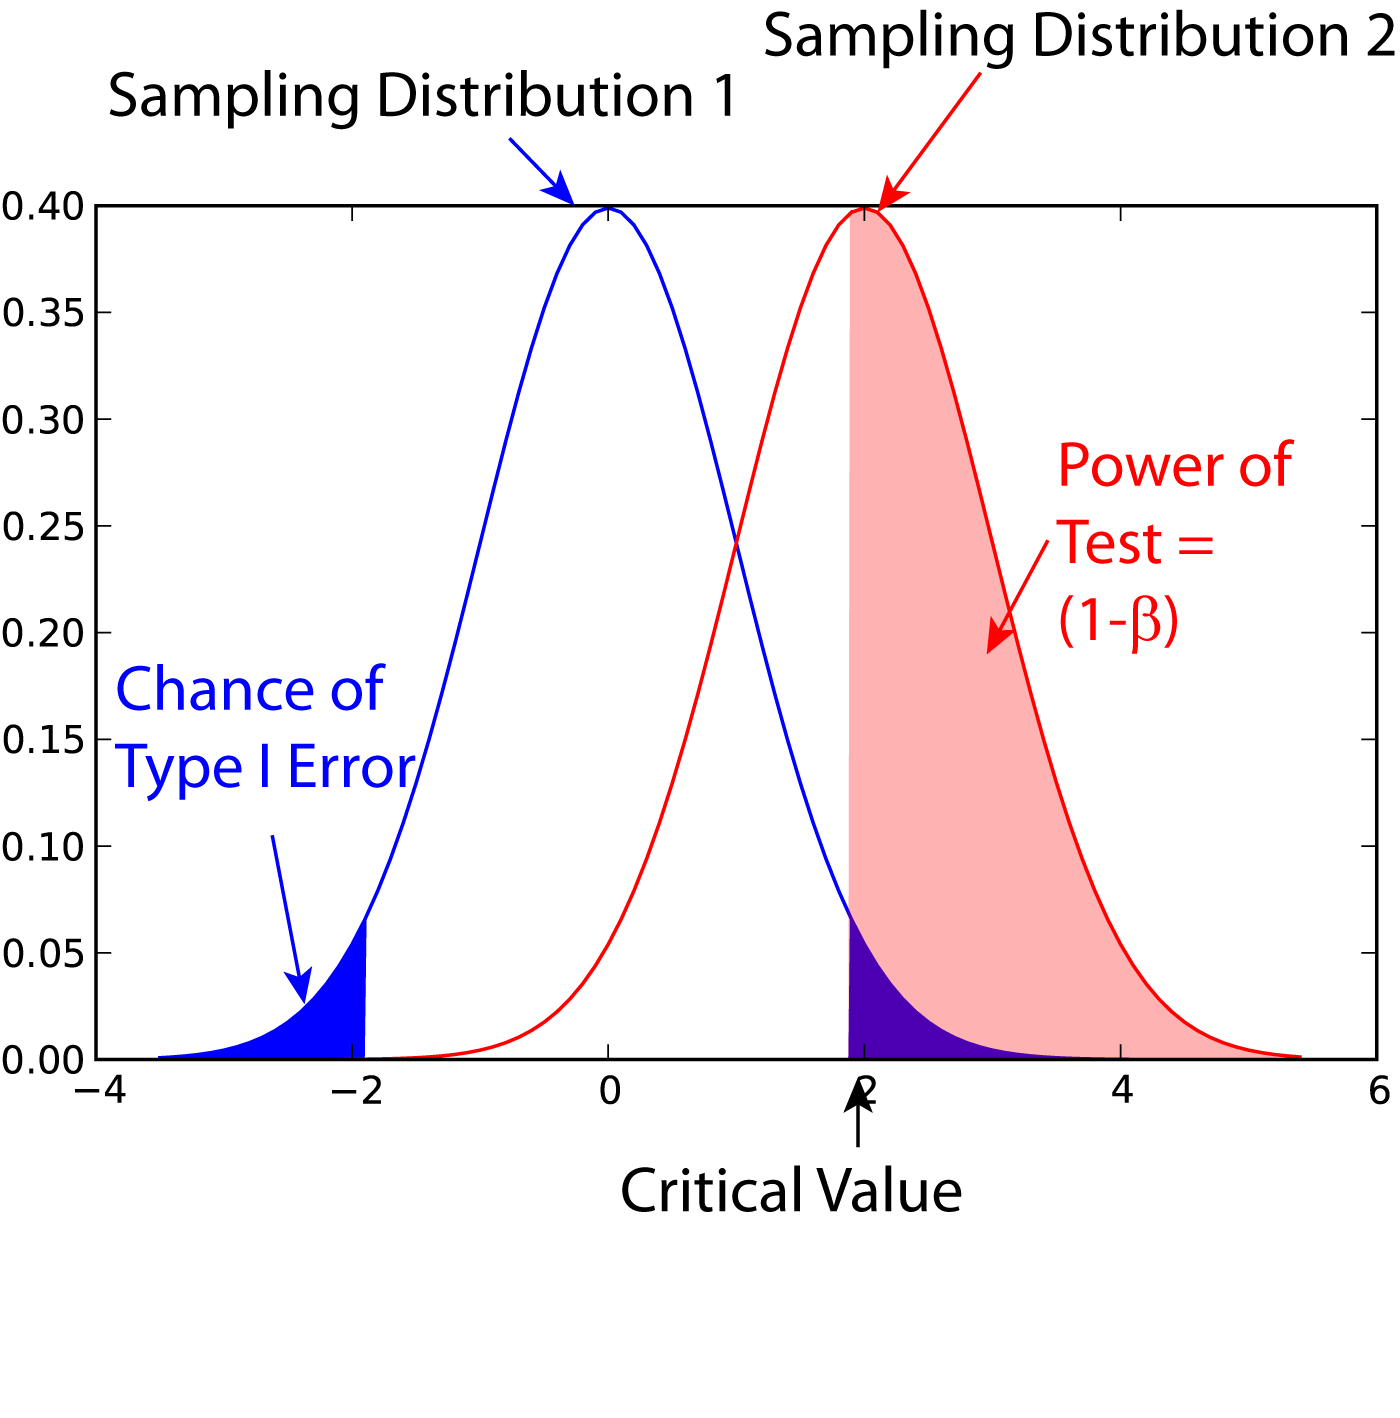
In statistics, the power of a binary hypothesis test is the probability that the test correctly rejects the null hypothesis (H_0) when a specific alternative hypothesis (H_1) is true. It is commonly denoted by 1-\beta, and represents the chances of a true positive detection conditional on the actual existence of an effect to detect. Statistical power ranges from 0 to 1, and as the power of a test increases, the probability \beta of making a type II error by wrongly failing to reject the null hypothesis decreases. Notation This article uses the following notation: * ''β'' = probability of a Type II error, known as a "false negative" * 1 − ''β'' = probability of a "true positive", i.e., correctly rejecting the null hypothesis. "1 − ''β''" is also known as the power of the test. * ''α'' = probability of a Type I error, known as a "false positive" * 1 − ''α'' = probability of a "true negative", i.e., correctly not rejecting the null hypothesis Description For a ... [...More Info...] [...Related Items...] OR: [Wikipedia] [Google] [Baidu] |
Statistical Significance
In statistical hypothesis testing, a result has statistical significance when it is very unlikely to have occurred given the null hypothesis (simply by chance alone). More precisely, a study's defined significance level, denoted by \alpha, is the probability of the study rejecting the null hypothesis, given that the null hypothesis is true; and the ''p''-value of a result, ''p'', is the probability of obtaining a result at least as extreme, given that the null hypothesis is true. The result is statistically significant, by the standards of the study, when p \le \alpha. The significance level for a study is chosen before data collection, and is typically set to 5% or much lower—depending on the field of study. In any experiment or observation that involves drawing a sample from a population, there is always the possibility that an observed effect would have occurred due to sampling error alone. But if the ''p''-value of an observed effect is less than (or equal to) the significan ... [...More Info...] [...Related Items...] OR: [Wikipedia] [Google] [Baidu] |
Confidence Interval
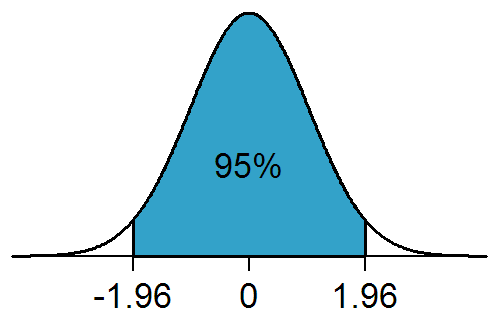
In frequentist statistics, a confidence interval (CI) is a range of estimates for an unknown parameter. A confidence interval is computed at a designated ''confidence level''; the 95% confidence level is most common, but other levels, such as 90% or 99%, are sometimes used. The confidence level represents the long-run proportion of corresponding CIs that contain the true value of the parameter. For example, out of all intervals computed at the 95% level, 95% of them should contain the parameter's true value. Factors affecting the width of the CI include the sample size, the variability in the sample, and the confidence level. All else being the same, a larger sample produces a narrower confidence interval, greater variability in the sample produces a wider confidence interval, and a higher confidence level produces a wider confidence interval. Definition Let be a random sample from a probability distribution with statistical parameter , which is a quantity to be esti ... [...More Info...] [...Related Items...] OR: [Wikipedia] [Google] [Baidu] |
Y-axis
A Cartesian coordinate system (, ) in a plane is a coordinate system that specifies each point uniquely by a pair of numerical coordinates, which are the signed distances to the point from two fixed perpendicular oriented lines, measured in the same unit of length. Each reference coordinate line is called a ''coordinate axis'' or just ''axis'' (plural ''axes'') of the system, and the point where they meet is its ''origin'', at ordered pair . The coordinates can also be defined as the positions of the perpendicular projections of the point onto the two axes, expressed as signed distances from the origin. One can use the same principle to specify the position of any point in three-dimensional space by three Cartesian coordinates, its signed distances to three mutually perpendicular planes (or, equivalently, by its perpendicular projection onto three mutually perpendicular lines). In general, ''n'' Cartesian coordinates (an element of real ''n''-space) specify the point in ... [...More Info...] [...Related Items...] OR: [Wikipedia] [Google] [Baidu] |


