|
Galbraith Plot
In statistics, a Galbraith plot (also known as Galbraith's radial plot or just radial plot) is one way of displaying several estimates of the same quantity that have different standard errors. It can be used to examine heterogeneity in a meta-analysis, as an alternative or supplement to a forest plot. A Galbraith plot is produced by first calculating the standardized estimates or ''z''-statistics by dividing each estimate by its standard error (SE). The Galbraith plot is then a scatter plot of each ''z''-statistic (vertical axis) against 1/SE (horizontal axis). Larger studies (with smaller SE and larger 1/SE) will be observed to aggregate away from the origin. See also * Plot * Funnel plot A funnel plot is a graph designed to check for the existence of publication bias; funnel plots are commonly used in systematic reviews and meta-analyses. In the absence of publication bias, it assumes that studies with high precision will be plotte ... References External links *Galbrai ... [...More Info...] [...Related Items...] OR: [Wikipedia] [Google] [Baidu] |
Statistics
Statistics (from German: '' Statistik'', "description of a state, a country") is the discipline that concerns the collection, organization, analysis, interpretation, and presentation of data. In applying statistics to a scientific, industrial, or social problem, it is conventional to begin with a statistical population or a statistical model to be studied. Populations can be diverse groups of people or objects such as "all people living in a country" or "every atom composing a crystal". Statistics deals with every aspect of data, including the planning of data collection in terms of the design of surveys and experiments.Dodge, Y. (2006) ''The Oxford Dictionary of Statistical Terms'', Oxford University Press. When census data cannot be collected, statisticians collect data by developing specific experiment designs and survey samples. Representative sampling assures that inferences and conclusions can reasonably extend from the sample to the population as a whole. An ex ... [...More Info...] [...Related Items...] OR: [Wikipedia] [Google] [Baidu] |
Standard Error
The standard error (SE) of a statistic (usually an estimate of a parameter) is the standard deviation of its sampling distribution or an estimate of that standard deviation. If the statistic is the sample mean, it is called the standard error of the mean (SEM). The sampling distribution of a mean is generated by repeated sampling from the same population and recording of the sample means obtained. This forms a distribution of different means, and this distribution has its own mean and variance. Mathematically, the variance of the sampling mean distribution obtained is equal to the variance of the population divided by the sample size. This is because as the sample size increases, sample means cluster more closely around the population mean. Therefore, the relationship between the standard error of the mean and the standard deviation is such that, for a given sample size, the standard error of the mean equals the standard deviation divided by the square root of the sample size ... [...More Info...] [...Related Items...] OR: [Wikipedia] [Google] [Baidu] |
Example Galbraith's Radial Plot
Example may refer to: * '' exempli gratia'' (e.g.), usually read out in English as "for example" * .example, reserved as a domain name that may not be installed as a top-level domain of the Internet ** example.com, example.net, example.org, example.edu, second-level domain names reserved for use in documentation as examples * HMS ''Example'' (P165), an Archer-class patrol and training vessel of the Royal Navy Arts * ''The Example'', a 1634 play by James Shirley * ''The Example'' (comics), a 2009 graphic novel by Tom Taylor and Colin Wilson * Example (musician), the British dance musician Elliot John Gleave (born 1982) * ''Example'' (album), a 1995 album by American rock band For Squirrels See also * * Exemplar (other), a prototype or model which others can use to understand a topic better * Exemplum, medieval collections of short stories to be told in sermons * Eixample The Eixample (; ) is a district of Barcelona between the old city (Ciutat Vella) and ... [...More Info...] [...Related Items...] OR: [Wikipedia] [Google] [Baidu] |
Heterogeneity
Homogeneity and heterogeneity are concepts often used in the sciences and statistics relating to the uniformity of a substance or organism. A material or image that is homogeneous is uniform in composition or character (i.e. color, shape, size, weight, height, distribution, texture, language, income, disease, temperature, radioactivity, architectural design, etc.); one that is heterogeneous is distinctly nonuniform in at least one of these qualities. Heterogeneous Mixtures, in chemistry, is where certain elements are unwillingly combined and, when given the option, will separate. Etymology and spelling The words ''homogeneous'' and ''heterogeneous'' come from Medieval Latin ''homogeneus'' and ''heterogeneus'', from Ancient Greek ὁμογενής (''homogenēs'') and ἑτερογενής (''heterogenēs''), from ὁμός (''homos'', “same”) and ἕτερος (''heteros'', “other, another, different”) respectively, followed by γένος (''genos'', “kind”); - ... [...More Info...] [...Related Items...] OR: [Wikipedia] [Google] [Baidu] |
Meta-analysis
A meta-analysis is a statistical analysis that combines the results of multiple scientific studies. Meta-analyses can be performed when there are multiple scientific studies addressing the same question, with each individual study reporting measurements that are expected to have some degree of error. The aim then is to use approaches from statistics to derive a pooled estimate closest to the unknown common truth based on how this error is perceived. Meta-analytic results are considered the most trustworthy source of evidence by the evidence-based medicine literature.Herrera Ortiz AF., Cadavid Camacho E, Cubillos Rojas J, Cadavid Camacho T, Zoe Guevara S, Tatiana Rincón Cuenca N, Vásquez Perdomo A, Del Castillo Herazo V, & Giraldo Malo R. A Practical Guide to Perform a Systematic Literature Review and Meta-analysis. Principles and Practice of Clinical Research. 2022;7(4):47–57. https://doi.org/10.21801/ppcrj.2021.74.6 Not only can meta-analyses provide an estimate of the u ... [...More Info...] [...Related Items...] OR: [Wikipedia] [Google] [Baidu] |
Forest Plot
A forest plot, also known as a blobbogram, is a graphical display of estimated results from a number of scientific studies addressing the same question, along with the overall results. It was developed for use in medical research as a means of graphically representing a meta-analysis of the results of randomized controlled trials. In the last twenty years, similar meta-analytical techniques have been applied in observational studies (e.g. environmental epidemiology) and forest plots are often used in presenting the results of such studies also. Although forest plots can take several forms, they are commonly presented with two columns. The left-hand column lists the names of the studies (frequently randomized controlled trials or epidemiological studies), commonly in chronological order from the top downwards. The right-hand column is a plot of the measure of effect (''e.g.'' an odds ratio) for each of these studies (often represented by a square) incorporating confidence interv ... [...More Info...] [...Related Items...] OR: [Wikipedia] [Google] [Baidu] |
Scatter Plot
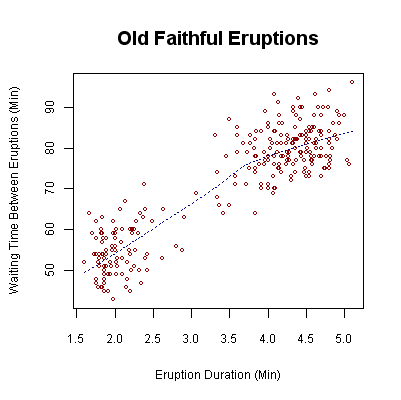
A scatter plot (also called a scatterplot, scatter graph, scatter chart, scattergram, or scatter diagram) is a type of plot or mathematical diagram using Cartesian coordinates to display values for typically two variables for a set of data. If the points are coded (color/shape/size), one additional variable can be displayed. The data are displayed as a collection of points, each having the value of one variable determining the position on the horizontal axis and the value of the other variable determining the position on the vertical axis. Overview A scatter plot can be used either when one continuous variable is under the control of the experimenter and the other depends on it or when both continuous variables are independent. If a parameter exists that is systematically incremented and/or decremented by the other, it is called the ''control parameter'' or independent variable and is customarily plotted along the horizontal axis. The measured or dependent variable is cu ... [...More Info...] [...Related Items...] OR: [Wikipedia] [Google] [Baidu] |
Plot (graphics)
A plot is a graphical technique for representing a data set, usually as a graph showing the relationship between two or more variables. The plot can be drawn by hand or by a computer. In the past, sometimes mechanical or electronic plotters were used. Graphs are a visual representation of the relationship between variables, which are very useful for humans who can then quickly derive an understanding which may not have come from lists of values. Given a scale or ruler, graphs can also be used to read off the value of an unknown variable plotted as a function of a known one, but this can also be done with data presented in tabular form. Graphs of functions are used in mathematics, sciences, engineering, technology, finance, and other areas. Overview Plots play an important role in statistics and data analysis. The procedures here can broadly be split into two parts: quantitative and graphical. Quantitative techniques are the set of statistical procedures that yield numeric or ... [...More Info...] [...Related Items...] OR: [Wikipedia] [Google] [Baidu] |
Funnel Plot
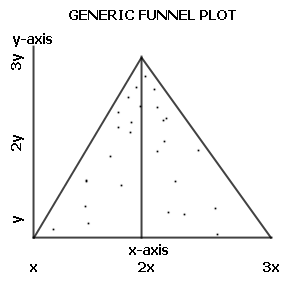
A funnel plot is a graph designed to check for the existence of publication bias; funnel plots are commonly used in systematic reviews and meta-analyses. In the absence of publication bias, it assumes that studies with high precision will be plotted near the average, and studies with low precision will be spread evenly on both sides of the average, creating a roughly funnel-shaped distribution. Deviation from this shape can indicate publication bias. Quotation Funnel plots, introduced by Light and Pillemer in 1984 and discussed in detail by Matthias Egger and colleagues, are useful adjuncts to meta-analyses. A funnel plot is a scatterplot of treatment effect against a measure of study precision. It is used primarily as a visual aid for detecting bias or systematic heterogeneity. A symmetric inverted funnel shape arises from a ‘well-behaved’ data set, in which publication bias is unlikely. An asymmetric funnel indicates a relationship between treatment effect estimate and stu ... [...More Info...] [...Related Items...] OR: [Wikipedia] [Google] [Baidu] |
Statistical Charts And Diagrams
Statistics (from German: ''Statistik'', "description of a state, a country") is the discipline that concerns the collection, organization, analysis, interpretation, and presentation of data. In applying statistics to a scientific, industrial, or social problem, it is conventional to begin with a statistical population or a statistical model to be studied. Populations can be diverse groups of people or objects such as "all people living in a country" or "every atom composing a crystal". Statistics deals with every aspect of data, including the planning of data collection in terms of the design of surveys and experiments.Dodge, Y. (2006) ''The Oxford Dictionary of Statistical Terms'', Oxford University Press. When census data cannot be collected, statisticians collect data by developing specific experiment designs and survey samples. Representative sampling assures that inferences and conclusions can reasonably extend from the sample to the population as a whole. An experim ... [...More Info...] [...Related Items...] OR: [Wikipedia] [Google] [Baidu] |


