|
True Strength Index
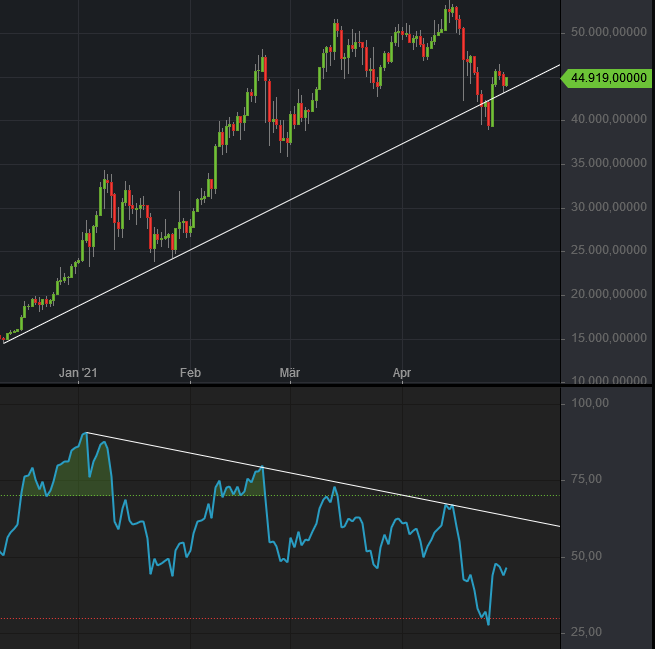
The true strength index (TSI) is a technical indicator used in the analysis of financial markets that attempts to show both trend direction and overbought/oversold conditions. It was first published William Blau in 1991. The indicator uses moving averages of the underlying momentum of a financial instrument. Momentum is considered a leading indicator of price movements, and a moving average characteristically lags behind price. The TSI combines these characteristics to create an indication of price and direction more in sync with market turns than either momentum or moving average. The TSI is provided as part of the standard collection of indicators offered by various trading platforms. Calculations The TSI is a "double smoothed" indicator; meaning that a moving average applied to the data (daily momentum in this case) is smoothed again by a second moving average. The calculation for TSI uses exponential moving averages. The formula for the TSI is: :TSI(c_0,r,s) = 100 \frac where ... [...More Info...] [...Related Items...] OR: [Wikipedia] [Google] [Baidu] |
Technical Indicator
In technical analysis in finance, a technical indicator is a mathematical calculation based on historic price, volume, or (in the case of futures contracts) open interest information that aims to forecast financial market direction. Technical indicators are a fundamental part of technical analysis and are typically plotted as a chart pattern to try to predict the market trend A market trend is a perceived tendency of financial markets to move in a particular direction over time. Analysts classify these trends as ''secular'' for long time-frames, ''primary'' for medium time-frames, and ''secondary'' for short time-fram .... Indicators generally overlay on price chart data to indicate where the price is going, or whether the price is in an "overbought" condition or an "oversold" condition. Many technical indicators have been developed and new variants continue to be developed by traders with the aim of getting better results. New Indicators are often backtested on historic pric ... [...More Info...] [...Related Items...] OR: [Wikipedia] [Google] [Baidu] |
Financial Markets
A financial market is a market in which people trade financial securities and derivatives at low transaction costs. Some of the securities include stocks and bonds, raw materials and precious metals, which are known in the financial markets as commodities. The term "market" is sometimes used for what are more strictly ''exchanges'', organizations that facilitate the trade in financial securities, e.g., a stock exchange or commodity exchange. This may be a physical location (such as the New York Stock Exchange (NYSE), London Stock Exchange (LSE), JSE Limited (JSE), Bombay Stock Exchange (BSE) or an electronic system such as NASDAQ. Much trading of stocks takes place on an exchange; still, corporate actions (merger, spinoff) are outside an exchange, while any two companies or people, for whatever reason, may agree to sell the stock from the one to the other without using an exchange. Trading of currencies and bonds is largely on a bilateral basis, although some bonds trade o ... [...More Info...] [...Related Items...] OR: [Wikipedia] [Google] [Baidu] |
Moving Average
In statistics, a moving average (rolling average or running average) is a calculation to analyze data points by creating a series of averages of different subsets of the full data set. It is also called a moving mean (MM) or rolling mean and is a type of finite impulse response filter. Variations include: simple, cumulative, or weighted forms (described below). Given a series of numbers and a fixed subset size, the first element of the moving average is obtained by taking the average of the initial fixed subset of the number series. Then the subset is modified by "shifting forward"; that is, excluding the first number of the series and including the next value in the subset. A moving average is commonly used with time series data to smooth out short-term fluctuations and highlight longer-term trends or cycles. The threshold between short-term and long-term depends on the application, and the parameters of the moving average will be set accordingly. It is also used in economics ... [...More Info...] [...Related Items...] OR: [Wikipedia] [Google] [Baidu] |
Momentum (technical Analysis)
In financial technical analysis, momentum (MTM) and rate of change (ROC) are simple indicators showing the difference between today's closing price and the close N days ago. Momentum is the absolute difference in stock, commodity: : \mathit = \mathit_\mathit - \mathit_ Rate of change scales by the old close, so as to represent the increase as a fraction, : \mathit = ''"Momentum"'' in general refers to prices continuing to trend. The momentum and ROC indicators show trend by remaining positive while an uptrend is sustained, or negative while a downtrend is sustained. A crossing up through zero may be used as a signal to buy, or a crossing down through zero as a signal to sell. How high (or how low when negative) the indicators get shows how strong the trend is. The way momentum shows an absolute change means it shows for instance a $3 rise over 20 days, whereas ROC might show that as 0.25 for a 25% rise over the same period. One can choose between looking at a move in doll ... [...More Info...] [...Related Items...] OR: [Wikipedia] [Google] [Baidu] |
Leading Indicator
An economic indicator is a statistic about an economic activity. Economic indicators allow analysis of economic performance and predictions of future performance. One application of economic indicators is the study of business cycles. Economic indicators include various indices, earnings reports, and economic summaries: for example, the unemployment rate, quits rate (quit rate in American English), housing starts, consumer price index (a measure for inflation), Inverted yield curve, consumer leverage ratio, industrial production, bankruptcies, gross domestic product, broadband internet penetration, retail sales, price index, and money supply changes. The leading business cycle dating committee in the United States of America is the private National Bureau of Economic Research. The Bureau of Labor Statistics is the principal fact-finding agency for the U.S. government in the field of labor economics and statistics. Other producers of economic indicators includes the United State ... [...More Info...] [...Related Items...] OR: [Wikipedia] [Google] [Baidu] |
Exponential Moving Average
In statistics, a moving average (rolling average or running average) is a calculation to analyze data points by creating a series of averages of different subsets of the full data set. It is also called a moving mean (MM) or rolling mean and is a type of finite impulse response filter. Variations include: simple, cumulative, or weighted forms (described below). Given a series of numbers and a fixed subset size, the first element of the moving average is obtained by taking the average of the initial fixed subset of the number series. Then the subset is modified by "shifting forward"; that is, excluding the first number of the series and including the next value in the subset. A moving average is commonly used with time series data to smooth out short-term fluctuations and highlight longer-term trends or cycles. The threshold between short-term and long-term depends on the application, and the parameters of the moving average will be set accordingly. It is also used in economics ... [...More Info...] [...Related Items...] OR: [Wikipedia] [Google] [Baidu] |
Relative Strength Index
The relative strength index (RSI) is a technical indicator used in the analysis of financial markets. It is intended to chart the current and historical strength or weakness of a stock or market based on the closing prices of a recent trading period. The indicator should not be confused with relative strength. The RSI is classified as a momentum oscillator, measuring the velocity and magnitude of price movements. Momentum is the rate of the rise or fall in price. The relative strength RS is given as the ratio of higher closes to lower closes, with closes here meaning averages of absolute values of price changes. The RSI computes momentum as the ratio of higher closes to overall closes: stocks which have had more or stronger positive changes have a higher RSI than stocks which have had more or stronger negative changes. The RSI is most typically used on a 14-day timeframe, measured on a scale from 0 to 100, with high and low levels marked at 70 and 30, respectively. Short or longer ... [...More Info...] [...Related Items...] OR: [Wikipedia] [Google] [Baidu] |


