|
Transportation Forecasting
Transportation forecasting is the attempt of estimating the number of vehicles or people that will use a specific transportation facility in the future. For instance, a forecast may estimate the number of vehicles on a planned road or bridge, the ridership on a railway line, the number of passengers visiting an airport, or the number of ships calling on a seaport. Traffic forecasting begins with the collection of data on current traffic. This traffic data is combined with other known data, such as population, employment, trip rates, travel costs, etc., to develop a traffic demand model for the current situation. Feeding it with predicted data for population, employment, etc. results in estimates of future traffic, typically estimated for each segment of the transportation infrastructure in question, e.g., for each roadway segment or railway station. The current technologies facilitate the access to dynamic data, big data, etc., providing the opportunity to develop new algorithms to i ... [...More Info...] [...Related Items...] OR: [Wikipedia] [Google] [Baidu] |
Road Space Requirements
A road is a thoroughfare used primarily for movement of traffic. Roads differ from streets, whose primary use is local access. They also differ from stroads, which combine the features of streets and roads. Most modern roads are Road surface, paved. The words "road" and "street" are commonly considered to be interchangeable, but the distinction is important in urban design. There are road hierarchy, many types of roads, including parkways, avenue (landscape), avenues, controlled-access highways (freeways, motorways, and expressways), tollways, interstates, highways, and local roads. The primary features of roads include lanes, sidewalks (pavement), roadways (carriageways), median strip, medians, shoulder (road), shoulders, road verge, verges, bike paths (cycle paths), and shared-use paths. Definitions Historically, many roads were simply recognizable routes without any formal construction or some maintenance. The Organisation for Economic Co-operation and Development, Organi ... [...More Info...] [...Related Items...] OR: [Wikipedia] [Google] [Baidu] |
Principle Of Maximum Entropy
The principle of maximum entropy states that the probability distribution which best represents the current state of knowledge about a system is the one with largest entropy, in the context of precisely stated prior data (such as a proposition that expresses testable information). Another way of stating this: Take precisely stated prior data or testable information about a probability distribution function. Consider the set of all trial probability distributions that would encode the prior data. According to this principle, the distribution with maximal information entropy is the best choice. History The principle was first expounded by E. T. Jaynes in two papers in 1957, where he emphasized a natural correspondence between statistical mechanics and information theory. In particular, Jaynes argued that the Gibbsian method of statistical mechanics is sound by also arguing that the entropy of statistical mechanics and the information entropy of information theory are the same ... [...More Info...] [...Related Items...] OR: [Wikipedia] [Google] [Baidu] |
Road Network
A street network is a system of interconnecting lines and points (called ''edges'' and ''nodes'' in network science) that represent a system of streets or roads for a given area. A street network provides the foundation for network analysis; for example, finding the best route or creating service areas.Wade, T. and Sommer, S. eds. A to Z GIS' They greatly affect in-town movement and traffic. Street networks can become very complex in cities. Street networks are very often localized, because there is little non-highway transportation from town to town. The U.S. Highway System is like a street network, but it is national, and consists of highways instead of streets and roads. See also * Braess's paradox * Transport network * Highway dimension * International E-road network * Inca road system * Traffic analysis ** Traffic flow In transportation engineering, traffic flow is the study of interactions between travellers (including pedestrians, cyclists, drivers, and their ve ... [...More Info...] [...Related Items...] OR: [Wikipedia] [Google] [Baidu] |
Big Data
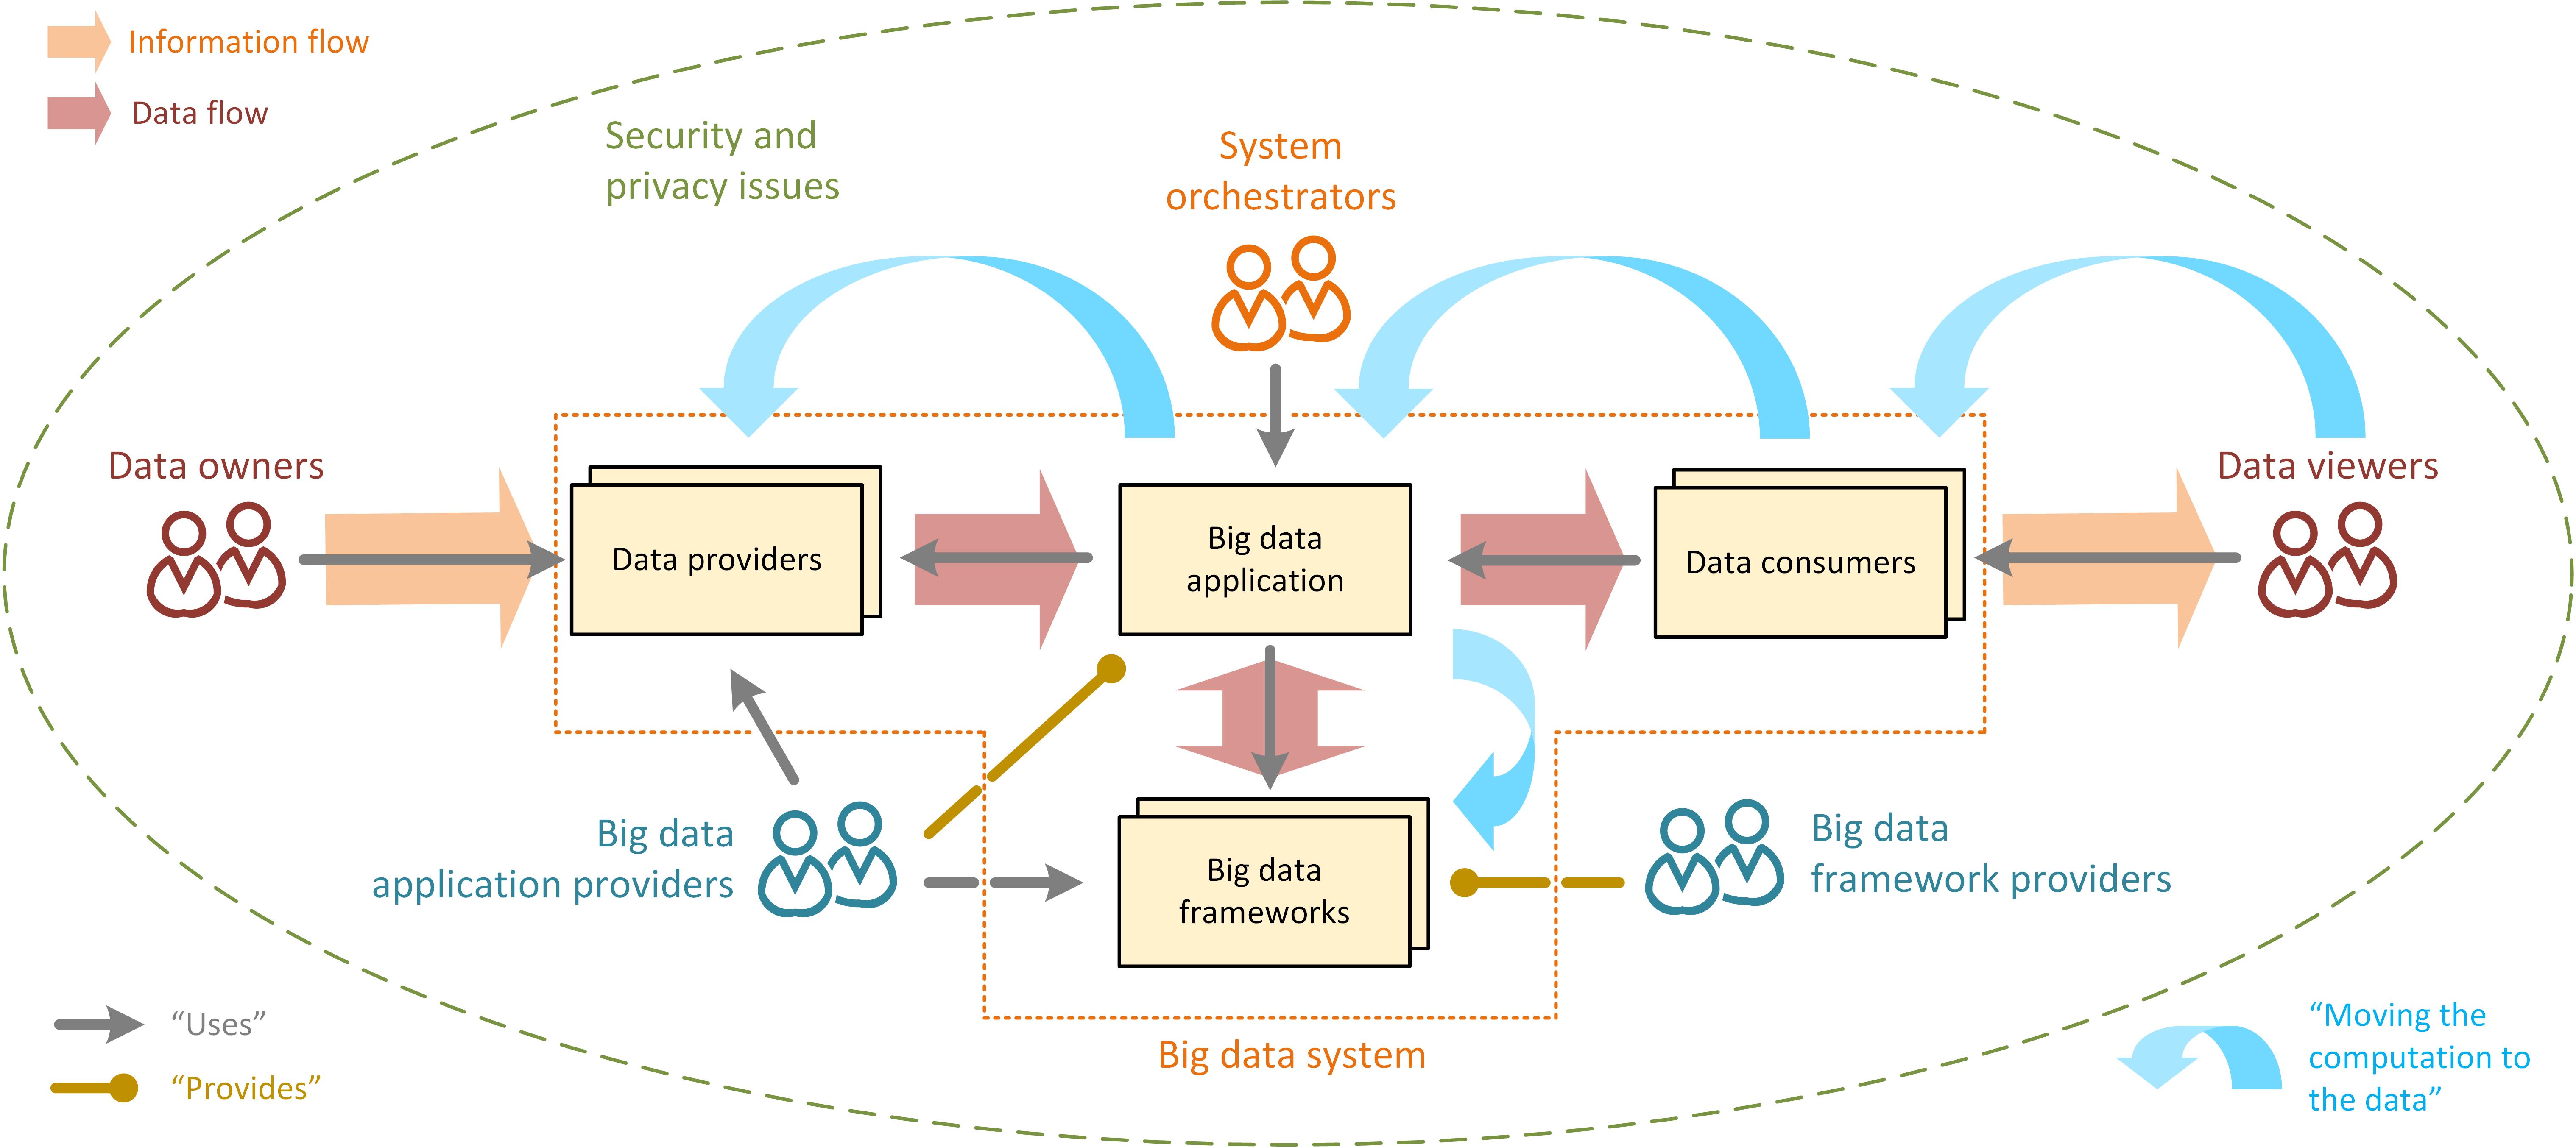
Big data primarily refers to data sets that are too large or complex to be dealt with by traditional data processing, data-processing application software, software. Data with many entries (rows) offer greater statistical power, while data with higher complexity (more attributes or columns) may lead to a higher false discovery rate. Big data analysis challenges include Automatic identification and data capture, capturing data, Computer data storage, data storage, data analysis, search, Data sharing, sharing, Data transmission, transfer, Data visualization, visualization, Query language, querying, updating, information privacy, and data source. Big data was originally associated with three key concepts: ''volume'', ''variety'', and ''velocity''. The analysis of big data presents challenges in sampling, and thus previously allowing for only observations and sampling. Thus a fourth concept, ''veracity,'' refers to the quality or insightfulness of the data. Without sufficient investm ... [...More Info...] [...Related Items...] OR: [Wikipedia] [Google] [Baidu] |
Data Science
Data science is an interdisciplinary academic field that uses statistics, scientific computing, scientific methods, processing, scientific visualization, algorithms and systems to extract or extrapolate knowledge from potentially noisy, structured, or unstructured data. Data science also integrates domain knowledge from the underlying application domain (e.g., natural sciences, information technology, and medicine). Data science is multifaceted and can be described as a science, a research paradigm, a research method, a discipline, a workflow, and a profession. Data science is "a concept to unify statistics, data analysis, informatics, and their related methods" to "understand and analyze actual phenomena" with data. It uses techniques and theories drawn from many fields within the context of mathematics, statistics, computer science, information science, and domain knowledge. However, data science is different from computer science and information science. Turing Awar ... [...More Info...] [...Related Items...] OR: [Wikipedia] [Google] [Baidu] |
Bilevel Optimization
Bilevel optimization is a special kind of optimization where one problem is embedded (nested) within another. The outer optimization task is commonly referred to as the upper-level optimization task, and the inner optimization task is commonly referred to as the lower-level optimization task. These problems involve two kinds of variables, referred to as the upper-level variables and the lower-level variables. Mathematical formulation of the problem A general formulation of the bilevel optimization problem can be written as follows: : \min\limits_\;\; F(x,y) subject to: : G_i(x,y) \leq 0, for i \in \ : y \in \arg \min \limits_ \ where : F,f: R^ \times R^ \to R : G_i,g_j: R^ \times R^ \to R : X \subseteq R^ : Y \subseteq R^. In the above formulation, F represents the upper-level objective function and f represents the lower-level objective function. Similarly x represents the upper-level decision vector and y represents the lower-level decision vector. G_i and g_j represent the ... [...More Info...] [...Related Items...] OR: [Wikipedia] [Google] [Baidu] |
Nash Equilibrium
In game theory, the Nash equilibrium is the most commonly used solution concept for non-cooperative games. A Nash equilibrium is a situation where no player could gain by changing their own strategy (holding all other players' strategies fixed). The idea of Nash equilibrium dates back to the time of Cournot, who in 1838 applied it to his model of competition in an oligopoly. If each player has chosen a strategy an action plan based on what has happened so far in the game and no one can increase one's own expected payoff by changing one's strategy while the other players keep theirs unchanged, then the current set of strategy choices constitutes a Nash equilibrium. If two players Alice and Bob choose strategies A and B, (A, B) is a Nash equilibrium if Alice has no other strategy available that does better than A at maximizing her payoff in response to Bob choosing B, and Bob has no other strategy available that does better than B at maximizing his payoff in response to Alice c ... [...More Info...] [...Related Items...] OR: [Wikipedia] [Google] [Baidu] |
User Equilibrium
John Glen Wardrop (1922–1989), born in Warwick, England, was an English mathematician and transport analyst who developed what became known as Wardrop's first and second principles of equilibrium in the field of traffic assignment. He studied at Downing College, Cambridge, and worked in Operational Research at British Bomber Command during the Second World War. He then helped to set up, and later headed, the Traffic Section of the Road Research Laboratory near Slough – part of the Directorate of Scientific and Industrial Research within the UK Civil Service – where he published his work on equilibrium. He subsequently followed Dr Reuben Smeed to University College London, becoming Reader Emeritus in Traffic Studies. Wardrop equilibria In studies about traffic assignment, network equilibrium models are commonly used for the prediction of traffic patterns in transportation networks that are subject to congestion. The idea of traffic equilibrium originated as ear ... [...More Info...] [...Related Items...] OR: [Wikipedia] [Google] [Baidu] |
Route Assignment
Route assignment, route choice, or traffic assignment concerns the selection of routes (alternatively called paths) between origins and destinations in transportation networks. It is the fourth step in the conventional transportation forecasting model, following trip generation, trip distribution, and mode choice. The zonal interchange analysis of trip distribution provides origin-destination trip tables. Mode choice analysis tells which travelers will use which mode. To determine facility needs and costs and benefits, we need to know the number of travelers on each route and link of the network (a route is simply a chain of links between an origin and destination). We need to undertake traffic (or trip) assignment. Suppose there is a network of highways and transit systems and a proposed addition. We first want to know the present pattern of traffic delay and then what would happen if the addition were made. General Approaches Long-standing techniques The problem of estim ... [...More Info...] [...Related Items...] OR: [Wikipedia] [Google] [Baidu] |
Logit
In statistics, the logit ( ) function is the quantile function associated with the standard logistic distribution. It has many uses in data analysis and machine learning, especially in Data transformation (statistics), data transformations. Mathematically, the logit is the inverse function, inverse of the logistic function, standard logistic function \sigma(x) = 1/(1+e^), so the logit is defined as : \operatorname p = \sigma^(p) = \ln \frac \quad \text \quad p \in (0,1). Because of this, the logit is also called the log-odds since it is equal to the logarithm of the odds \frac where is a probability. Thus, the logit is a type of function that maps probability values from (0, 1) to real numbers in (-\infty, +\infty), akin to the probit, probit function. Definition If is a probability, then is the corresponding odds; the of the probability is the logarithm of the odds, i.e.: : \operatorname(p)=\ln\left( \frac \right) =\ln(p)-\ln(1-p)=-\ln\left( \frac-1\right)=2\operatornam ... [...More Info...] [...Related Items...] OR: [Wikipedia] [Google] [Baidu] |


