|
Spatial Econometrics
Spatial econometrics is the field where spatial analysis and econometrics intersect. The term “spatial econometrics” was introduced for the first time by the Belgian economist Jean Paelinck (universally recognised as the father of the discipline) in the general address he delivered to the annual meeting of the Dutch Statistical Association in May 1974 (Paelinck and Klaassen, 1979). In general, econometrics differs from other branches of statistics in focusing on theoretical models, whose parameters are estimated using regression analysis. Spatial econometrics is a refinement of this, where either the theoretical model involves interactions between different entities, or the data observations are not truly independent. Thus, models incorporating spatial auto-correlation or neighborhood effects can be estimated using spatial econometric methods. Such models are common in regional science, real estate economics, education economics, housing market and many others. Adopting a mor ... [...More Info...] [...Related Items...] OR: [Wikipedia] [Google] [Baidu] |
Spatial Analysis
Spatial analysis or spatial statistics includes any of the formal techniques which studies entities using their topological, geometric, or geographic properties. Spatial analysis includes a variety of techniques, many still in their early development, using different analytic approaches and applied in fields as diverse as astronomy, with its studies of the placement of galaxies in the cosmos, to chip fabrication engineering, with its use of "place and route" algorithms to build complex wiring structures. In a more restricted sense, spatial analysis is the technique applied to structures at the human scale, most notably in the analysis of geographic data or transcriptomics data. Complex issues arise in spatial analysis, many of which are neither clearly defined nor completely resolved, but form the basis for current research. The most fundamental of these is the problem of defining the spatial location of the entities being studied. Classification of the techniques of spatial ... [...More Info...] [...Related Items...] OR: [Wikipedia] [Google] [Baidu] |
Social Network
A social network is a social structure made up of a set of social actors (such as individuals or organizations), sets of dyadic ties, and other social interactions between actors. The social network perspective provides a set of methods for analyzing the structure of whole social entities as well as a variety of theories explaining the patterns observed in these structures. The study of these structures uses social network analysis to identify local and global patterns, locate influential entities, and examine network dynamics. Social networks and the analysis of them is an inherently interdisciplinary academic field which emerged from social psychology, sociology, statistics, and graph theory. Georg Simmel authored early structural theories in sociology emphasizing the dynamics of triads and "web of group affiliations". Jacob Moreno is credited with developing the first sociograms in the 1930s to study interpersonal relationships. These approaches were mathematicall ... [...More Info...] [...Related Items...] OR: [Wikipedia] [Google] [Baidu] |
Econometric Modeling
Econometric models are statistical models used in econometrics. An econometric model specifies the statistical relationship that is believed to hold between the various economic quantities pertaining to a particular economic phenomenon. An econometric model can be derived from a deterministic economic model by allowing for uncertainty, or from an economic model which itself is stochastic. However, it is also possible to use econometric models that are not tied to any specific economic theory. A simple example of an econometric model is one that assumes that monthly spending by consumers is linearly dependent on consumers' income in the previous month. Then the model will consist of the equation :C_t = a + bY_ + e_t, where ''C''''t'' is consumer spending in month ''t'', ''Y''''t''-1 is income during the previous month, and ''et'' is an error term measuring the extent to which the model cannot fully explain consumption. Then one objective of the econometrician is to obtain esti ... [...More Info...] [...Related Items...] OR: [Wikipedia] [Google] [Baidu] |
Regression Analysis
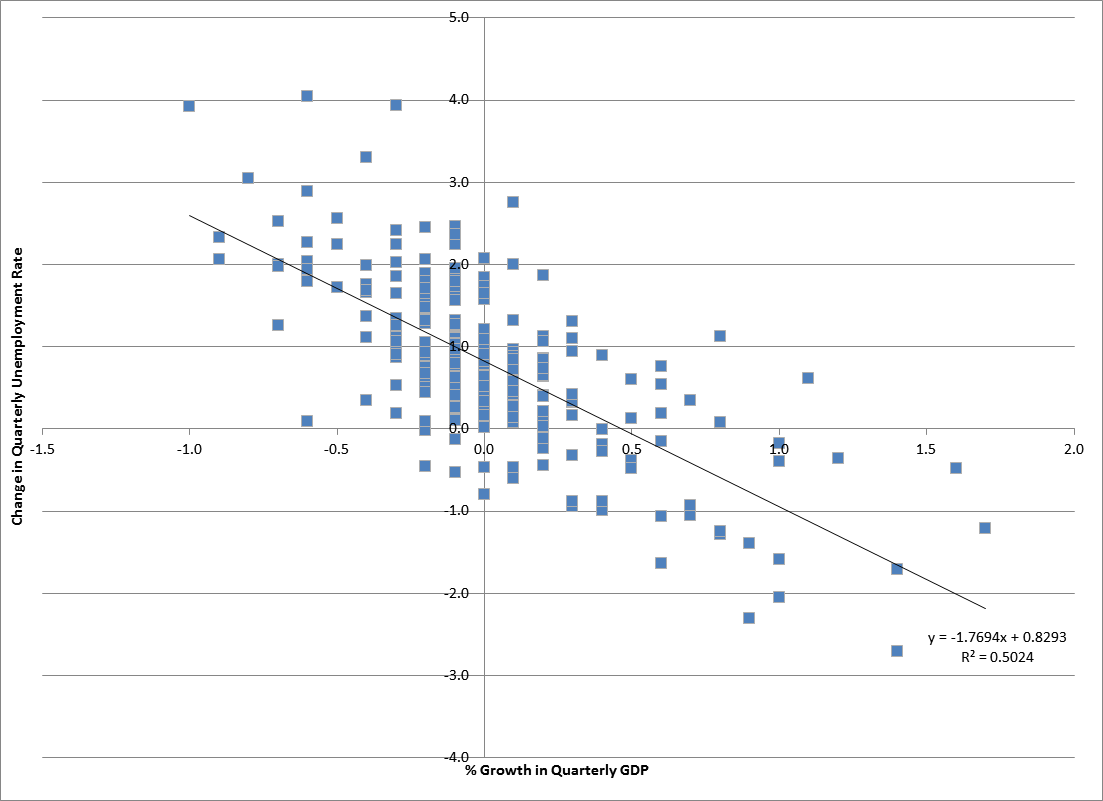
In statistical modeling, regression analysis is a set of statistical processes for estimating the relationships between a dependent variable (often called the 'outcome' or 'response' variable, or a 'label' in machine learning parlance) and one or more independent variables (often called 'predictors', 'covariates', 'explanatory variables' or 'features'). The most common form of regression analysis is linear regression, in which one finds the line (or a more complex linear combination) that most closely fits the data according to a specific mathematical criterion. For example, the method of ordinary least squares computes the unique line (or hyperplane) that minimizes the sum of squared differences between the true data and that line (or hyperplane). For specific mathematical reasons (see linear regression), this allows the researcher to estimate the conditional expectation (or population average value) of the dependent variable when the independent variables take on a give ... [...More Info...] [...Related Items...] OR: [Wikipedia] [Google] [Baidu] |
Correlation
In statistics, correlation or dependence is any statistical relationship, whether causal or not, between two random variables or bivariate data. Although in the broadest sense, "correlation" may indicate any type of association, in statistics it usually refers to the degree to which a pair of variables are ''linearly'' related. Familiar examples of dependent phenomena include the correlation between the height of parents and their offspring, and the correlation between the price of a good and the quantity the consumers are willing to purchase, as it is depicted in the so-called demand curve. Correlations are useful because they can indicate a predictive relationship that can be exploited in practice. For example, an electrical utility may produce less power on a mild day based on the correlation between electricity demand and weather. In this example, there is a causal relationship, because extreme weather causes people to use more electricity for heating or cooling. Howev ... [...More Info...] [...Related Items...] OR: [Wikipedia] [Google] [Baidu] |
Spatial Analysis
Spatial analysis or spatial statistics includes any of the formal techniques which studies entities using their topological, geometric, or geographic properties. Spatial analysis includes a variety of techniques, many still in their early development, using different analytic approaches and applied in fields as diverse as astronomy, with its studies of the placement of galaxies in the cosmos, to chip fabrication engineering, with its use of "place and route" algorithms to build complex wiring structures. In a more restricted sense, spatial analysis is the technique applied to structures at the human scale, most notably in the analysis of geographic data or transcriptomics data. Complex issues arise in spatial analysis, many of which are neither clearly defined nor completely resolved, but form the basis for current research. The most fundamental of these is the problem of defining the spatial location of the entities being studied. Classification of the techniques of spatial ... [...More Info...] [...Related Items...] OR: [Wikipedia] [Google] [Baidu] |
Modifiable Areal Unit Problem
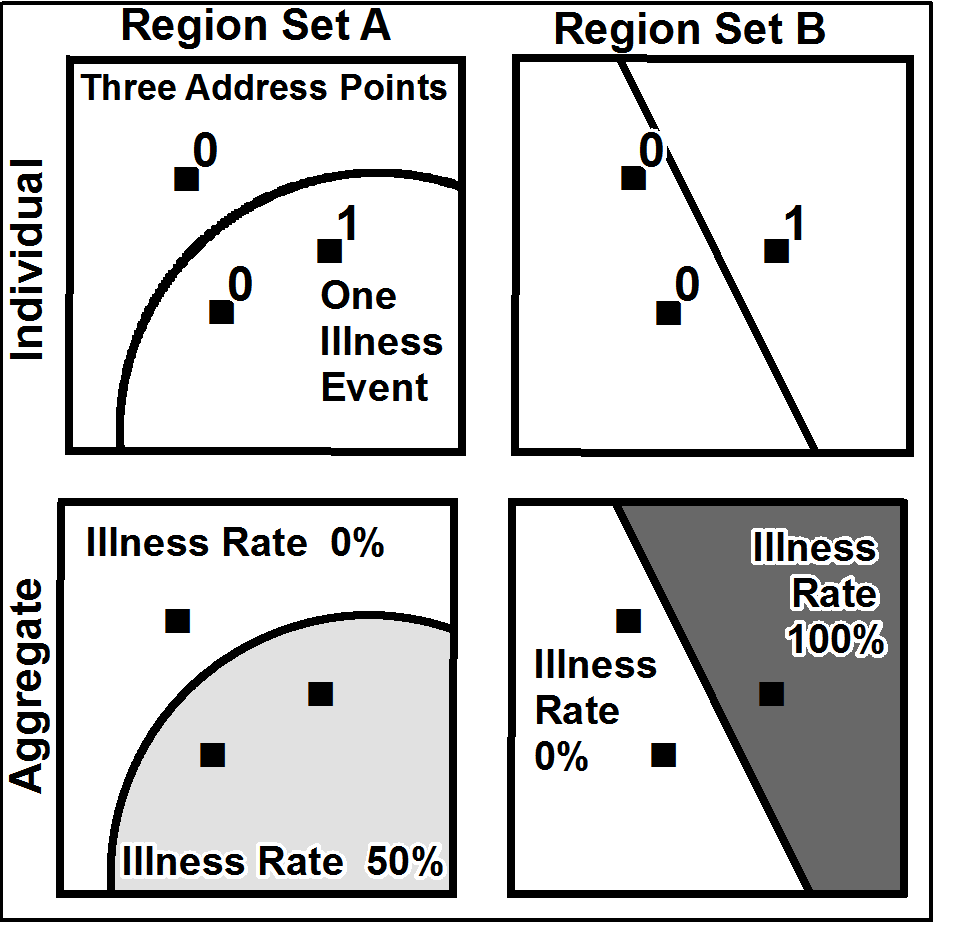
__NOTOC__ The modifiable areal unit problem (MAUP) is a source of statistical bias that can significantly impact the results of statistical hypothesis tests. MAUP affects results when point-based measures of spatial phenomena are aggregated into districts, for example, population density or illness rates. The resulting summary values (e.g., totals, rates, proportions, densities) are influenced by both the shape and scale of the aggregation unit. For example, census data may be aggregated into county districts, census tracts, postcode areas, police precincts, or any other arbitrary spatial partition. Thus the results of data aggregation are dependent on the mapmaker's choice of which "modifiable areal unit" to use in their analysis. A census choropleth map calculating population density using state boundaries will yield radically different results than a map that calculates density based on county boundaries. Furthermore, census district boundaries are also subject to change over t ... [...More Info...] [...Related Items...] OR: [Wikipedia] [Google] [Baidu] |
Complete Spatial Randomness
Complete spatial randomness (CSR) describes a point process whereby point events occur within a given study area in a completely random fashion. It is synonymous with a ''homogeneous spatial Poisson process''.O. Maimon, L. Rokach, ''Data Mining and Knowledge Discovery Handbook'' , Second Edition, Springer 2010, pages 851-852 Such a process is modeled using only one parameter \rho, i.e. the density of points within the defined area. The term complete spatial randomness is commonly used in Applied Statistics in the context of examining certain point patterns, whereas in most other statistical contexts it is referred to the concept of a spatial Poisson process.O. Maimon, L. Rokach, ''Data Mining and Knowledge Discovery Handbook'' , Second Edition, Springer 2010, pages 851-852 Model Data in the form of a set of points, irregularly distributed within a region of space, arise in many different contexts; examples include locations of trees in a forest, of nests of birds, of nuclei i ... [...More Info...] [...Related Items...] OR: [Wikipedia] [Google] [Baidu] |
Spatial Autocorrelation
Spatial analysis or spatial statistics includes any of the formal techniques which studies entities using their topological, geometric, or geographic properties. Spatial analysis includes a variety of techniques, many still in their early development, using different analytic approaches and applied in fields as diverse as astronomy, with its studies of the placement of galaxies in the cosmos, to chip fabrication engineering, with its use of "place and route" algorithms to build complex wiring structures. In a more restricted sense, spatial analysis is the technique applied to structures at the human scale, most notably in the analysis of geographic data or transcriptomics data. Complex issues arise in spatial analysis, many of which are neither clearly defined nor completely resolved, but form the basis for current research. The most fundamental of these is the problem of defining the spatial location of the entities being studied. Classification of the techniques of spatial ... [...More Info...] [...Related Items...] OR: [Wikipedia] [Google] [Baidu] |
Geographic Information Science
Geographic information science or geographical information science (GIScience or GISc) is the scientific discipline that studies geographic information, including how it represents phenomena in the real world, how it represents the way humans understand the world, and how it can be captured, organized, and analyzed. It can be contrasted with geographic information systems (GIS), which are the actual repositories of such data, the software tools for carrying out relevant tasks, and the profession of GIS users. That said, one of the major goals of GIScience is to find practical ways to improve GIS data, software, and professional practice. it is more focused on how gis is applied in real life British geographer Michael Goodchild defined this area in the 1990s and summarized its core interests, including spatial analysis, visualization, and the representation of uncertainty. GIScience is conceptually related to geomatics, information science, computer science, but it claims the s ... [...More Info...] [...Related Items...] OR: [Wikipedia] [Google] [Baidu] |
Spatial Econometrics Association
Spatial may refer to: *Dimension *Space *Three-dimensional space Three-dimensional space (also: 3D space, 3-space or, rarely, tri-dimensional space) is a geometric setting in which three values (called ''parameters'') are required to determine the position of an element (i.e., point). This is the informa ... See also * * {{disambig ... [...More Info...] [...Related Items...] OR: [Wikipedia] [Google] [Baidu] |
Econometrics
Econometrics is the application of statistical methods to economic data in order to give empirical content to economic relationships. M. Hashem Pesaran (1987). "Econometrics," '' The New Palgrave: A Dictionary of Economics'', v. 2, p. 8 p. 8–22 Reprinted in J. Eatwell ''et al.'', eds. (1990). ''Econometrics: The New Palgrave''p. 1 p. 1–34Abstract (2008 revision by J. Geweke, J. Horowitz, and H. P. Pesaran). More precisely, it is "the quantitative analysis of actual economic phenomena based on the concurrent development of theory and observation, related by appropriate methods of inference". An introductory economics textbook describes econometrics as allowing economists "to sift through mountains of data to extract simple relationships". Jan Tinbergen is one of the two founding fathers of econometrics. The other, Ragnar Frisch, also coined the term in the sense in which it is used today. A basic tool for econometrics is the multiple linear regression model. ''Economet ... [...More Info...] [...Related Items...] OR: [Wikipedia] [Google] [Baidu] |


