|
Stock Market Cycles
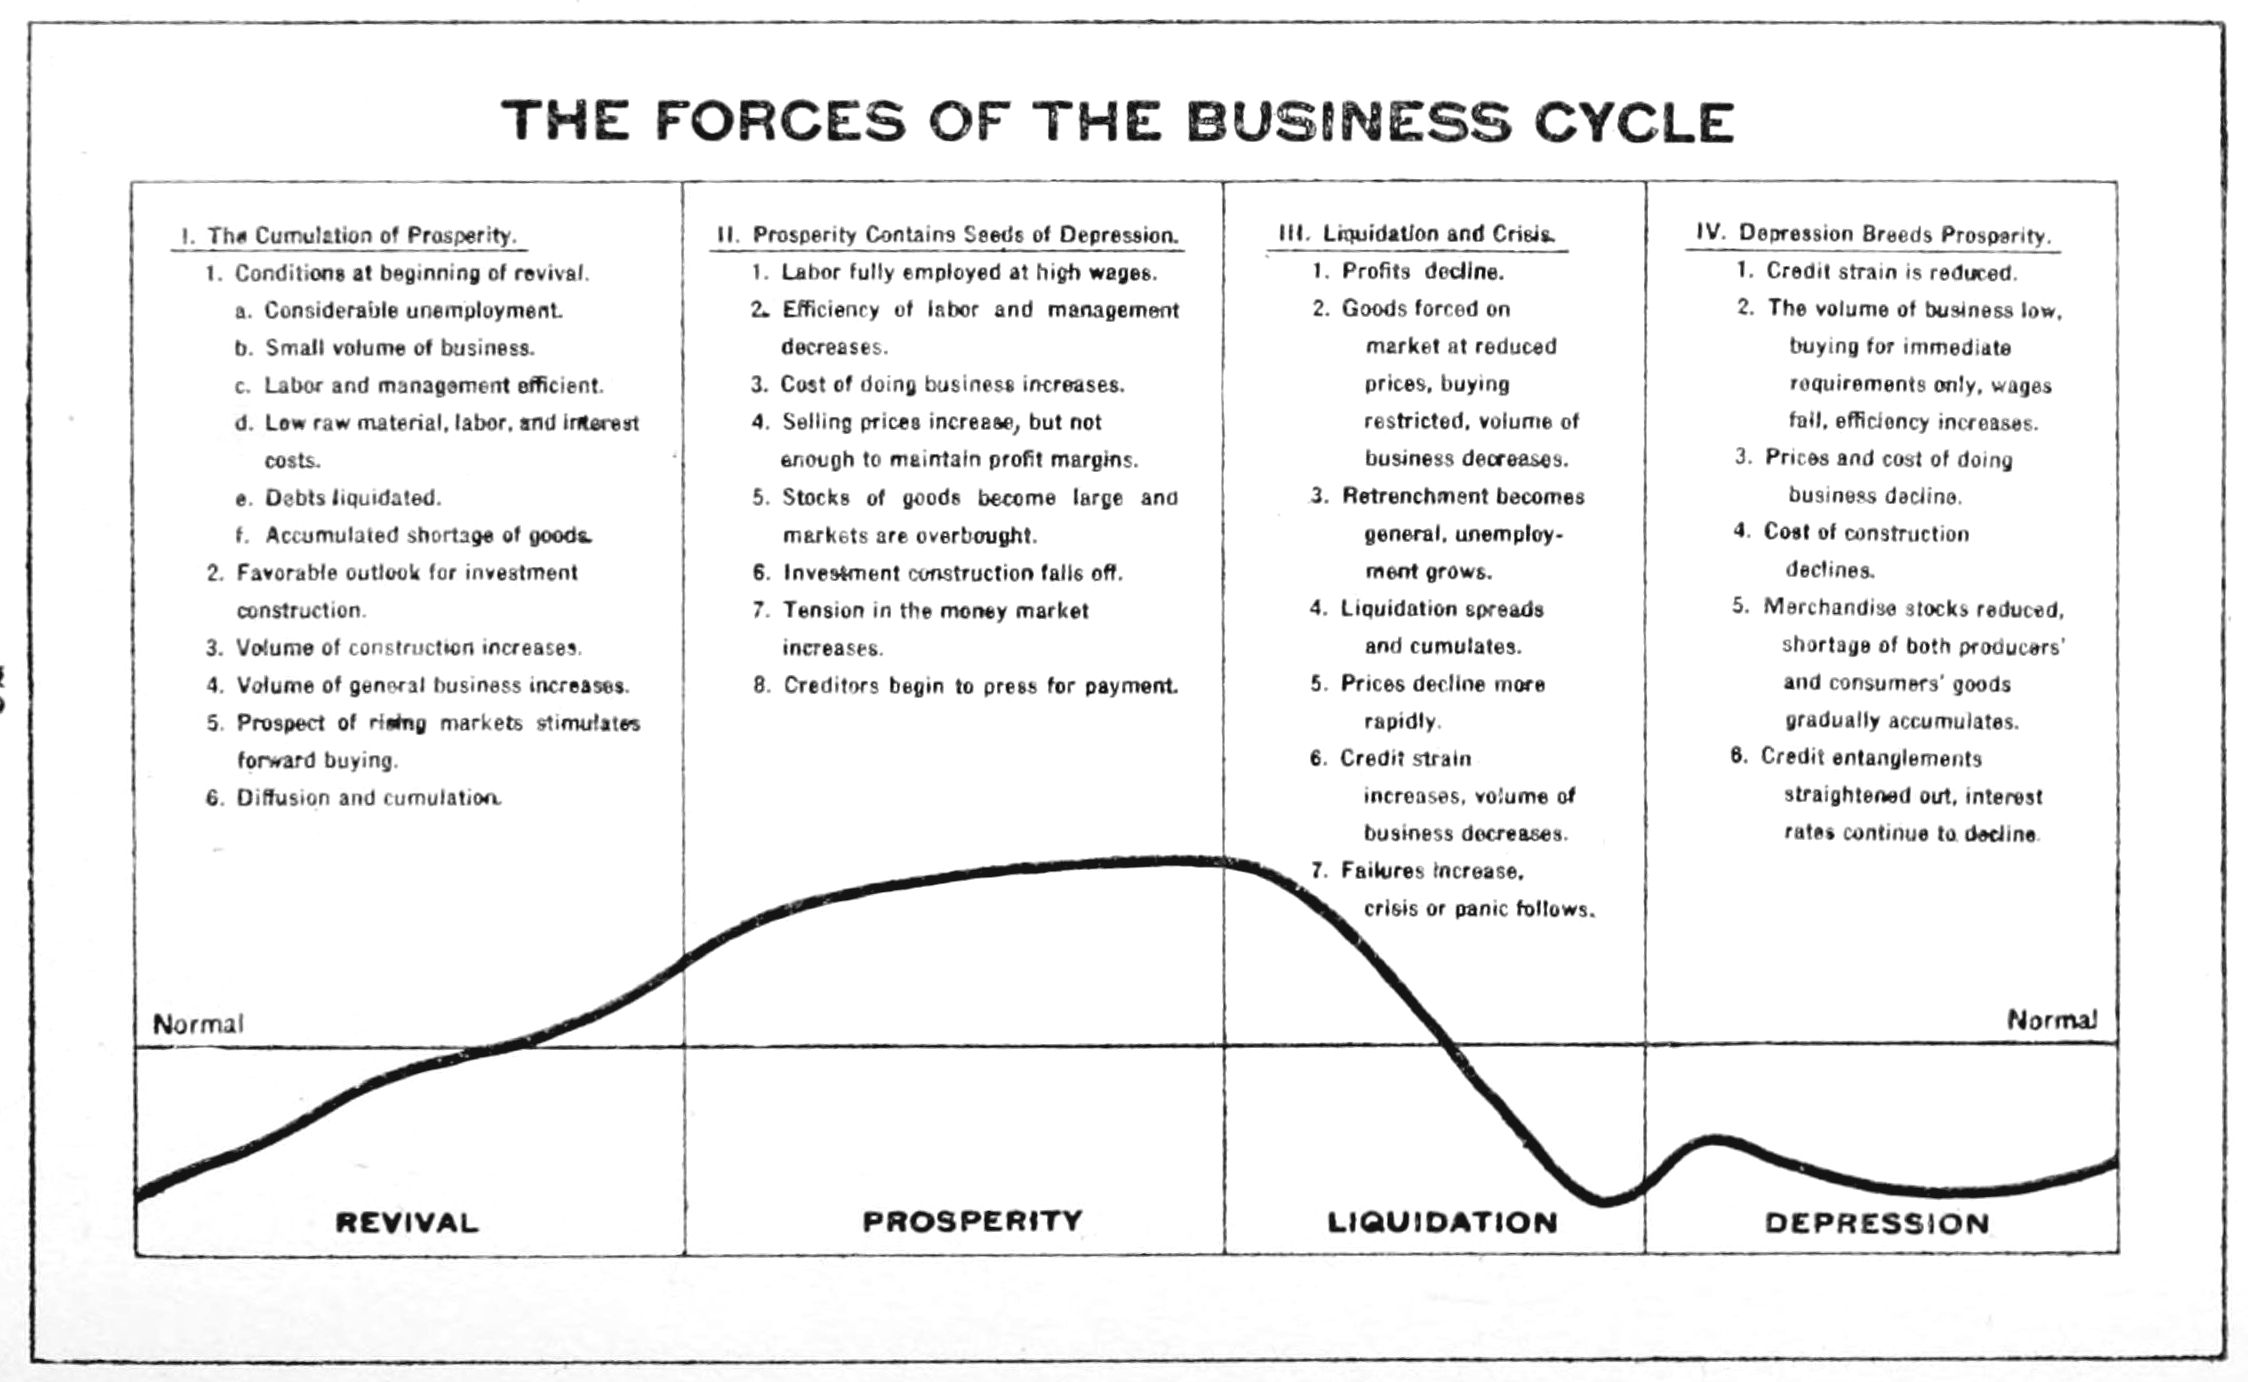
''See Business Cycle.'' Stock market cycles are proposed patterns that proponents argue may exist in stock markets. Many such cycles have been proposed, such as tying stock market changes to political leadership, or fluctuations in commodity prices. Some stock market patterns are universally recognized (e.g., rotations between dominance of value investing or growth stocks). However, many academics and professional investors are skeptical of any theory claiming to precisely identify or predict stock market cycles. Some sources argue identifying any such patterns as a "cycle" is a misnomer, because of their non-cyclical nature. Changes in stock returns are primarily determined by external factors such as the U.S. monetary policy, the economy, inflation, exchange rates, and socioeconomic conditions (e.g., the 2020-2021 coronavirus pandemic). Intellectual capital does not affect a company stock's current earnings. Intellectual capital contributes to a stock's return growth. Econom ... [...More Info...] [...Related Items...] OR: [Wikipedia] [Google] [Baidu] |
Business Cycle
Business cycles are intervals of Economic expansion, expansion followed by recession in economic activity. These changes have implications for the welfare of the broad population as well as for private institutions. Typically business cycles are measured by examining trends in a broad economic indicator such as Real Gross Domestic Production. Business cycle fluctuations are usually characterized by general upswings and downturns in a span of macroeconomic variables. The individual episodes of expansion/recession occur with changing duration and intensity over time. Typically their periodicity has a wide range from around 2 to 10 years (the technical phrase "stochastic cycle" is often used in statistics to describe this kind of process.) As in [Harvey, Trimbur, and van Dijk, 2007, ''Journal of Econometrics''], such flexible knowledge about the frequency of business cycles can actually be included in their mathematical study, using a Bayesian statistical paradigm. There are numer ... [...More Info...] [...Related Items...] OR: [Wikipedia] [Google] [Baidu] |
Macroeconomic Model
A macroeconomic model is an analytical tool designed to describe the operation of the problems of economy of a country or a region. These models are usually designed to examine the comparative statics and dynamics of aggregate quantities such as the total amount of goods and services produced, total income earned, the level of employment of productive resources, and the level of prices. Macroeconomic models may be logical, mathematical, and/or computational; the different types of macroeconomic models serve different purposes and have different advantages and disadvantages. Macroeconomic models may be used to clarify and illustrate basic theoretical principles; they may be used to test, compare, and quantify different macroeconomic theories; they may be used to produce "what if" scenarios (usually to predict the effects of changes in monetary, fiscal, or other macroeconomic policies); and they may be used to generate economic forecasts. Thus, macroeconomic models are widely use ... [...More Info...] [...Related Items...] OR: [Wikipedia] [Google] [Baidu] |
Trend Following
Trend following or trend trading is a trading strategy according to which one should buy an asset when its price trend goes up, and sell when its trend goes down, expecting price movements to continue. There are a number of different techniques, calculations and time-frames that may be used to determine the general direction of the market to generate a trade signal, including the current market price calculation, moving averages and channel breakouts. Traders who employ this strategy do not aim to forecast or predict specific price levels; they simply jump on the trend and ride it. Due to the different techniques and time frames employed by trend followers to identify trends, trend followers as a group are not always strongly correlated to one another. Trend following is used by commodity trading advisors (CTAs) as the predominant strategy of technical traders. Research done by Galen Burghardt has shown that between 2000-2009 there was a very high correlation (.97) between tren ... [...More Info...] [...Related Items...] OR: [Wikipedia] [Google] [Baidu] |
Market Trends
A market trend is a perceived tendency of financial markets to move in a particular direction over time. Analysts classify these trends as ''secular'' for long time-frames, ''primary'' for medium time-frames, and ''secondary'' for short time-frames. Traders attempt to identify market trends using technical analysis, a framework which characterizes market trends as predictable price tendencies within the market when price reaches support and resistance levels, varying over time. A market trend can only be determined in hindsight, since at any time prices in the future are not known. Market terminology The terms "bull market" and "bear market" describe upward and downward market trends, respectively, and can be used to describe either the market as a whole or specific sectors and securities. The terms come from London's Exchange Alley in the early 18th century, where traders who engaged in naked short selling were called "bear-skin jobbers" because they sold a bear's skin (the s ... [...More Info...] [...Related Items...] OR: [Wikipedia] [Google] [Baidu] |
Bottom (technical Analysis)
A chart pattern or price pattern is a pattern within a chart when prices are graphed. In stock and commodity markets trading, chart pattern studies play a large role during technical analysis. When data is plotted there is usually a pattern which naturally occurs and repeats over a period. Chart patterns are used as either reversal or continuation signals. There are three main types of chart patterns which are used by technical analysts: traditional chart patternHarmonic Patterns* candlestick pattern Traditional Chart Pattern Included in this type are the most common patterns which have been introduced to chartists for more than a hundred years. Below is a list of the most commonly used traditional chart patterns: Reversal Patterns: # Double Top Reversal # Double Bottom Reversal # Triple Top Reversal # Triple Bottom Reversal # Head and Shoulders # Key Reversal Bar Continuation Patterns: # Triangle # Flag and Pennant # Channel # Cup with Handle Harmonic Pattern Harmonic ... [...More Info...] [...Related Items...] OR: [Wikipedia] [Google] [Baidu] |
Market Timing
Market timing is the strategy of making buying or selling decisions of financial assets (often stocks) by attempting to predict future market price movements. The prediction may be based on an outlook of market or economic conditions resulting from technical or fundamental analysis. This is an investment strategy based on the outlook for an aggregate market rather than for a particular financial asset. The efficient-market hypothesis is an assumption that asset prices reflect all available information, meaning that it is theoretically impossible to systematically "beat the market." Approaches Market timing can cause poor performance. After fees, the average "trend follower" does not show skills or abilities compared to benchmarks. "Trend Tracker" reported returns are distorted by survivor bias, selection bias, and fill bias. At the Federal Reserve Bank of St. Louis, YiLi Chien, Senior Economist wrote about return-chasing behavior. The average equity mutual fund investor tends to ... [...More Info...] [...Related Items...] OR: [Wikipedia] [Google] [Baidu] |
Technical Analysis
In finance, technical analysis is an analysis methodology for analysing and forecasting the direction of prices through the study of past market data, primarily price and volume. Behavioral economics and quantitative analysis use many of the same tools of technical analysis, which, being an aspect of active management, stands in contradiction to much of modern portfolio theory. The efficacy of both technical and fundamental analysis is disputed by the efficient-market hypothesis, which states that stock market prices are essentially unpredictable, and research on whether technical analysis offers any benefit has produced mixed results. History The principles of technical analysis are derived from hundreds of years of financial market data. Some aspects of technical analysis began to appear in Amsterdam-based merchant Joseph de la Vega's accounts of the Dutch financial markets in the 17th century. In Asia, technical analysis is said to be a method developed by Homma Munehisa duri ... [...More Info...] [...Related Items...] OR: [Wikipedia] [Google] [Baidu] |
Yield Curve
In finance, the yield curve is a graph which depicts how the yields on debt instruments - such as bonds - vary as a function of their years remaining to maturity. Typically, the graph's horizontal or x-axis is a time line of months or years remaining to maturity, with the shortest maturity on the left and progressively longer time periods on the right. The vertical or y-axis depicts the annualized yield to maturity. Those who issue and trade in forms of debt, such as loans and bonds, use yield curves to determine their value. Shifts in the shape and slope of the yield curve are thought to be related to investor expectations for the economy and interest rates. Ronald Melicher and Merle Welshans have identified several characteristics of a properly constructed yield curve. It should be based on a set of securities which have differing lengths of time to maturity, and all yields should be calculated as of the same point in time. All securities measured in the yield curve ... [...More Info...] [...Related Items...] OR: [Wikipedia] [Google] [Baidu] |
National Bureau Of Economic Research
The National Bureau of Economic Research (NBER) is an American private nonprofit research organization "committed to undertaking and disseminating unbiased economic research among public policymakers, business professionals, and the academic community". The NBER is well known for providing start and end dates for recessions in the United States. Many chairpersons of the Council of Economic Advisers were previously NBER Research Associates, including the former NBER president and Harvard Professor, Martin Feldstein. The NBER's president and CEO is James M. Poterba of MIT. History The NBER was founded in 1920. Its first staff economist, director of research, and one of its founders was American economist Wesley Clair Mitchell. He was succeeded by Malcolm C. Rorty in 1922. The Russian American economist Simon Kuznets, a student of Mitchell, was working at the NBER when the U.S. government recruited him to oversee the production of the first official estimates of national in ... [...More Info...] [...Related Items...] OR: [Wikipedia] [Google] [Baidu] |
Business Cycle Models
Business is the practice of making one's living or making money by producing or buying and selling products (such as goods and services). It is also "any activity or enterprise entered into for profit." Having a business name does not separate the business entity from the owner, which means that the owner of the business is responsible and liable for debts incurred by the business. If the business acquires debts, the creditors can go after the owner's personal possessions. A business structure does not allow for corporate tax rates. The proprietor is personally taxed on all income from the business. The term is also often used colloquially (but not by lawyers or by public officials) to refer to a company, such as a corporation or cooperative. Corporations, in contrast with sole proprietors and partnerships, are a separate legal entity and provide limited liability for their owners/members, as well as being subject to corporate tax rates. A corporation is more complicated and ... [...More Info...] [...Related Items...] OR: [Wikipedia] [Google] [Baidu] |
Business Cycle
Business cycles are intervals of Economic expansion, expansion followed by recession in economic activity. These changes have implications for the welfare of the broad population as well as for private institutions. Typically business cycles are measured by examining trends in a broad economic indicator such as Real Gross Domestic Production. Business cycle fluctuations are usually characterized by general upswings and downturns in a span of macroeconomic variables. The individual episodes of expansion/recession occur with changing duration and intensity over time. Typically their periodicity has a wide range from around 2 to 10 years (the technical phrase "stochastic cycle" is often used in statistics to describe this kind of process.) As in [Harvey, Trimbur, and van Dijk, 2007, ''Journal of Econometrics''], such flexible knowledge about the frequency of business cycles can actually be included in their mathematical study, using a Bayesian statistical paradigm. There are numer ... [...More Info...] [...Related Items...] OR: [Wikipedia] [Google] [Baidu] |


