|
Network Charts
A project network diagram is a graph that displays the order in which a project’s activities are to be completed. Derived from the work breakdown structure, the terminal elements of a project are organized sequentially based on the relationship among them. It is typically drawn from left to right to reflect project chronology. Techniques Activity-on-Node The Activity-on-Node (AON) technique uses nodes to represent individual project activities and path arrows to designate the sequence of activity completion. Nodes are labelled using information pertaining to the activity. According to Project Management, nodes should at least display the following information: * Identifier * Descriptive label * Activity duration * Early start time * Early finish time * Late start time * Late finish time * Activity float (slack) Start and finish times are used to determine the critical path of a project. Activity float, or slack, time is used in project crashing. Other techniq ... [...More Info...] [...Related Items...] OR: [Wikipedia] [Google] [Baidu] |
Information Graphics
Infographics (a clipped compound of "information" and "graphics") are graphic visual representations of information, data, or knowledge intended to present information quickly and clearly.Doug Newsom and Jim Haynes (2004). ''Public Relations Writing: Form and Style''. p.236. They can improve cognition by utilizing graphics to enhance the human visual system's ability to see patterns and trends.Card, S. (2009). Information visualization. In A. Sears & J. A. Jacko (Eds.), Human-Computer Interaction: Design Issues, Solutions, and Applications (pp. 510-543). Boca Raton, FL: CRC Press. Similar pursuits are information visualization, data visualization, statistical graphics, information design, or information architecture. Infographics have evolved in recent years to be for mass communication, and thus are designed with fewer assumptions about the readers' knowledge base than other types of visualizations. Isotypes are an early example of infographics conveying information quickly ... [...More Info...] [...Related Items...] OR: [Wikipedia] [Google] [Baidu] |
Charts
A chart (sometimes known as a graph) is a graphical representation for data visualization, in which "the data is represented by symbols, such as bars in a bar chart, lines in a line chart, or slices in a pie chart". A chart can represent tabular numeric data, functions or some kinds of quality structure and provides different info. The term "chart" as a graphical representation of data has multiple meanings: * A data chart is a type of diagram or graph, that organizes and represents a set of numerical or qualitative data. * Maps that are adorned with extra information (map surround) for a specific purpose are often known as charts, such as a nautical chart or aeronautical chart, typically spread over several map sheets. * Other domain-specific constructs are sometimes called charts, such as the chord chart in music notation or a record chart for album popularity. Charts are often used to ease understanding of large quantities of data and the relationships between parts ... [...More Info...] [...Related Items...] OR: [Wikipedia] [Google] [Baidu] |
Program Evaluation And Review Technique
The program evaluation and review technique (PERT) is a statistical tool used in project management, which was designed to analyze and represent the tasks involved in completing a given project. First developed by the United States Navy in 1958, it is commonly used in conjunction with the critical path method (CPM) that was introduced in 1957. Overview PERT is a method of analyzing the tasks involved in completing a given project, especially the time needed to complete each task, and to identify the minimum time needed to complete the total project. It incorporates uncertainty by making it possible to schedule a project while not knowing precisely the details and durations of all the activities. It is more of an event-oriented technique rather than start- and completion-oriented, and is used more in those projects where time is the major factor rather than cost. It is applied on very large-scale, one-time, complex, non-routine infrastructure and on Research and Developmen ... [...More Info...] [...Related Items...] OR: [Wikipedia] [Google] [Baidu] |
Project Planning
Project planning is part of project management, which relates to the use of schedules such as Gantt charts to plan and subsequently report progress within the project environment. Project planning can be done manually or by the use of project management software. Description Initially, the project scope is defined and the appropriate methods for completing the project are determined. Following this step, the durations for the various tasks necessary to complete the work are listed and grouped into a work breakdown structure. Project planning is often used to organize different areas of a project, including project plans, work loads and the management of teams and individuals. The logical dependencies between tasks are defined using an activity network diagram that enables identification of the critical path. Project planning is inherently uncertain as it must be done before the project is actually started. Therefore, the duration of the tasks is often estimated through a ... [...More Info...] [...Related Items...] OR: [Wikipedia] [Google] [Baidu] |
Project Management
Project management is the process of leading the work of a team to achieve all project goals within the given constraints. This information is usually described in project documentation, created at the beginning of the development process. The primary constraints are scope, time, and budget. The secondary challenge is to optimize the allocation of necessary inputs and apply them to meet pre-defined objectives. The objective of project management is to produce a complete project which complies with the client's objectives. In many cases, the objective of project management is also to shape or reform the client's brief to feasibly address the client's objectives. Once the client's objectives are clearly established, they should influence all decisions made by other people involved in the project – for example, project managers, designers, contractors, and subcontractors. Ill-defined or too tightly prescribed project management objectives are detrimental to decision-ma ... [...More Info...] [...Related Items...] OR: [Wikipedia] [Google] [Baidu] |
Gantt Chart
A Gantt chart is a type of bar chart that illustrates a project schedule, named after its popularizer, Henry Gantt (1861–1919), who designed such a chart around the years 1910–1915. Modern Gantt charts also show the dependency relationships between activities and the current schedule status. Definition A Gantt chart is a type of bar chart that illustrates a project schedule. This chart lists the tasks to be performed on the vertical axis, and time intervals on the horizontal axis. The width of the horizontal bars in the graph shows the duration of each activity. Gantt charts illustrate the start and finish dates of the terminal elements and summary elements of a project. Terminal elements and summary elements constitute the work breakdown structure of the project. Modern Gantt charts also show the dependency (i.e., precedence network) relationships between activities. Gantt charts can be used to show current schedule status using percent-complete shadings and a vertic ... [...More Info...] [...Related Items...] OR: [Wikipedia] [Google] [Baidu] |
Bar Chart
A bar chart or bar graph is a chart or graph that presents categorical data with rectangular bars with heights or length Length is a measure of distance. In the International System of Quantities, length is a quantity with dimension distance. In most systems of measurement a base unit for length is chosen, from which all other units are derived. In the Inte ...s proportional to the values that they represent. The bars can be plotted vertically or horizontally. A vertical bar chart is sometimes called a column chart. A bar graph shows comparisons among discrete categories. One axis of the chart shows the specific categories being compared, and the other axis represents a measured value. Some bar graphs present bars clustered in groups of more than one, showing the values of more than one measured variable. History Many sources consider William Playfair (1759-1824) to have invented the bar chart and the ''Exports and Imports of Scotland to and from different parts ... [...More Info...] [...Related Items...] OR: [Wikipedia] [Google] [Baidu] |
Project Management Software
Project management software (PMS) has the capacity to help plan, organize, and manage resource tools and develop resource estimates. Depending on the sophistication of the software, it can manage estimation and planning, scheduling, cost control and budget management, resource allocation, collaboration software, communication, decision-making, quality management, time management and documentation or administration systems. Numerous PC and browser-based project management software and contract management software products and services are available. History Predecessors The first historically relevant year for the development of project management software is 1896, marked by the introduction of the Harmonogram. Polish economist Karol Adamiecki attempted to display task development in a floating chart, and laid the foundation for project management software as it is today. 1912 was the year when Henry Gantt replaced the Harmonogram with the more advanced Gantt chart, a scheduling ... [...More Info...] [...Related Items...] OR: [Wikipedia] [Google] [Baidu] |
Work Breakdown Structure
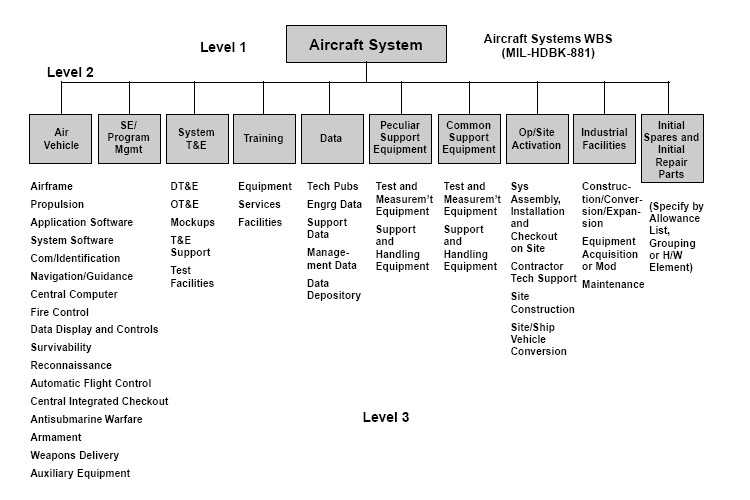
A work-breakdown structure (WBS) in project management and systems engineering is a deliverable-oriented breakdown of a project into smaller components. A work breakdown structure is a key project deliverable that organizes the team's work into manageable sections. The Project Management Body of Knowledge (PMBOK 5) defines the work-breakdown structure as a "hierarchical decomposition of the total scope of work to be carried out by the project team to accomplish the project objectives and create the required deliverables." A work-breakdown structure element may be a product, data, service, or any combination of these. A WBS also provides the necessary framework for detailed cost estimation and control while providing guidance for schedule development and control.Booz, Allen & HamiltoEarned Value Management Tutorial Module 2: Work Breakdown Structure [...More Info...] [...Related Items...] OR: [Wikipedia] [Google] [Baidu] |
Circular Reference
A circular reference is a series of references where the last object references the first, resulting in a closed loop. In language A circular reference is not to be confused with the logical fallacy of a circular argument. Although a circular reference will often be unhelpful and reveal no information, such as two entries in a book index referring to each other, it is not necessarily so that a circular reference is of no use. Dictionaries, for instance, must always ultimately be a circular reference since all words in a dictionary are defined in terms of other words, but a dictionary nevertheless remains a useful reference. Sentences containing circular references can still be meaningful: :''Her brother gave her a kitten; his sister thanked him for it.'' is circular, but not without meaning. Indeed, it can be argued that self-reference is a necessary consequence of Aristotle's Law of non-contradiction, a fundamental philosophical axiom. In this view, without self-refere ... [...More Info...] [...Related Items...] OR: [Wikipedia] [Google] [Baidu] |
Float (project Management)
In project management, float or slack is the amount of time that a task in a project network can be delayed without causing a delay to: * subsequent tasks ("''free float''") * project completion date ("''total float''"). ''Total float'' is associated with the path. If a project network chart/diagram has 4 non-critical paths then that project would have 4 ''total float'' values. The ''total float'' of a path is the combined ''free float'' values of all activities in a path. The ''total float'' represents the schedule flexibility and can also be measured by subtracting early start dates from late start dates of path completion. Float is core to critical path method, with the total floats of noncritical activities key to computing the critical path drag of an activity, i.e., the amount of time it is adding to the project's duration.* Example Consider the process of replacing a broken pane of glass in the window of your home. There are various component activities involved in the p ... [...More Info...] [...Related Items...] OR: [Wikipedia] [Google] [Baidu] |


