|
Multidimensional Panel Data
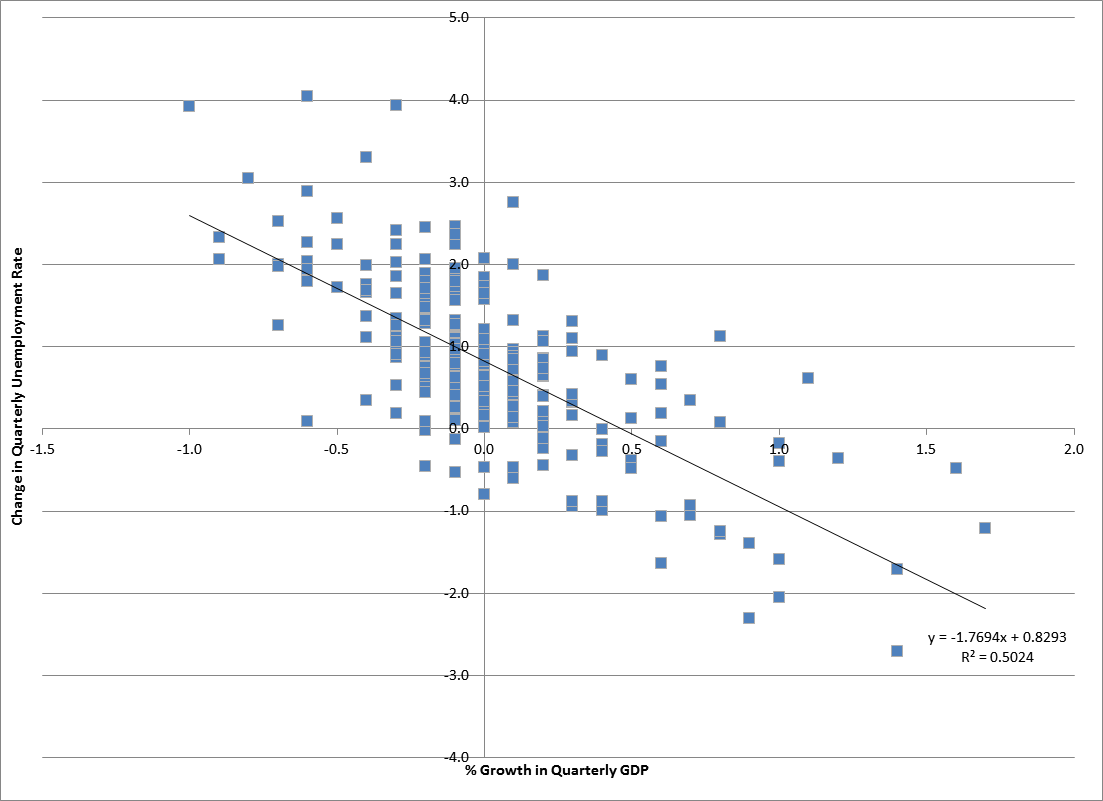
In econometrics, a multidimensional panel data is data of a phenomenon observed over three or more dimensions. This comes in contrast with panel data, observed over two dimensions (typically, time and cross-sections). An example is a data set containing forecasts of one or multiple macroeconomic variables produced by multiple individuals (the first dimension), in multiple series (the second dimension) at multiple times periods (the third dimension) and for multiple horizons (the fourth dimension). Analysis of multidimensional panel data A multidimensional panel with four dimensions can have the form : X_, \; i = 1, \dots, N, \; s = 1, \dots, S, \; t = 1, \dots, T, \; h = 1, \dots, H, \, where ''i'' is the individual dimension, ''s'' is the series dimension, ''t'' is the time dimension, and ''h'' is the horizon dimension. A general multidimensional panel data regression model is written as : y_ = \alpha + X_ \beta + u_.\, Complex assumptions can be made on the precise structur ... [...More Info...] [...Related Items...] OR: [Wikipedia] [Google] [Baidu] |
Econometrics
Econometrics is the application of statistical methods to economic data in order to give empirical content to economic relationships.M. Hashem Pesaran (1987). "Econometrics," '' The New Palgrave: A Dictionary of Economics'', v. 2, p. 8 p. 8–22 Reprinted in J. Eatwell ''et al.'', eds. (1990). ''Econometrics: The New Palgrave''p. 1p. 1–34Abstract (2008 revision by J. Geweke, J. Horowitz, and H. P. Pesaran). More precisely, it is "the quantitative analysis of actual economic phenomena based on the concurrent development of theory and observation, related by appropriate methods of inference". An introductory economics textbook describes econometrics as allowing economists "to sift through mountains of data to extract simple relationships". Jan Tinbergen is one of the two founding fathers of econometrics. The other, Ragnar Frisch, also coined the term in the sense in which it is used today. A basic tool for econometrics is the multiple linear regression model. ''Econometric the ... [...More Info...] [...Related Items...] OR: [Wikipedia] [Google] [Baidu] |
Panel Data
In statistics and econometrics, panel data and longitudinal data are both multi-dimensional data involving measurements over time. Panel data is a subset of longitudinal data where observations are for the same subjects each time. Time series and cross-sectional data can be thought of as special cases of panel data that are in one dimension only (one panel member or individual for the former, one time point for the latter). A study that uses panel data is called a longitudinal study or panel study. Example In the multiple response permutation procedure (MRPP) example above, two datasets with a panel structure are shown and the objective is to test whether there's a significant difference between people in the sample data. Individual characteristics (income, age, sex) are collected for different persons and different years. In the first dataset, two persons (1, 2) are observed every year for three years (2016, 2017, 2018). In the second dataset, three persons (1, 2, 3) are obs ... [...More Info...] [...Related Items...] OR: [Wikipedia] [Google] [Baidu] |
Time Series
In mathematics, a time series is a series of data points indexed (or listed or graphed) in time order. Most commonly, a time series is a sequence taken at successive equally spaced points in time. Thus it is a sequence of discrete-time data. Examples of time series are heights of ocean tides, counts of sunspots, and the daily closing value of the Dow Jones Industrial Average. A time series is very frequently plotted via a run chart (which is a temporal line chart). Time series are used in statistics, signal processing, pattern recognition, econometrics, mathematical finance, weather forecasting, earthquake prediction, electroencephalography, control engineering, astronomy, communications engineering, and largely in any domain of applied science and engineering which involves temporal measurements. Time series ''analysis'' comprises methods for analyzing time series data in order to extract meaningful statistics and other characteristics of the data. Time series ''for ... [...More Info...] [...Related Items...] OR: [Wikipedia] [Google] [Baidu] |
Cross-sectional Study
In medical research, social science, and biology, a cross-sectional study (also known as a cross-sectional analysis, transverse study, prevalence study) is a type of observational study that analyzes data from a population, or a representative subset, ''at a specific point in time''—that is, cross-sectional data. In economics, cross-sectional studies typically involve the use of cross-sectional regression, in order to sort out the existence and magnitude of causal effects of one independent variable upon a dependent variable of interest at a given point in time. They differ from time series analysis, in which the behavior of one or more economic aggregates is traced through time. In medical research, cross-sectional studies differ from case-control studies in that they aim to provide data on the entire population under study, whereas case-control studies typically include only individuals who have developed a specific condition and compare them with a matched sample, o ... [...More Info...] [...Related Items...] OR: [Wikipedia] [Google] [Baidu] |
Regression Model
In statistical modeling, regression analysis is a set of statistical processes for estimating the relationships between a dependent variable (often called the 'outcome' or 'response' variable, or a 'label' in machine learning parlance) and one or more independent variables (often called 'predictors', 'covariates', 'explanatory variables' or 'features'). The most common form of regression analysis is linear regression, in which one finds the line (or a more complex linear combination) that most closely fits the data according to a specific mathematical criterion. For example, the method of ordinary least squares computes the unique line (or hyperplane) that minimizes the sum of squared differences between the true data and that line (or hyperplane). For specific mathematical reasons (see linear regression), this allows the researcher to estimate the conditional expectation (or population average value) of the dependent variable when the independent variables take on a given set o ... [...More Info...] [...Related Items...] OR: [Wikipedia] [Google] [Baidu] |


