|
Color–color Diagram
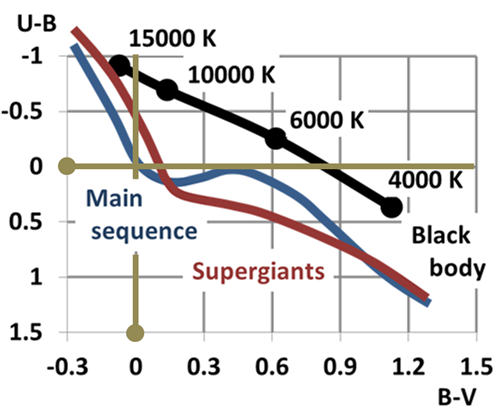
A color–color diagram is a means of comparing the colors of an astronomical object at different wavelengths. Astronomers typically observe at narrow bands around certain wavelengths, and objects observed will have different brightnesses in each band. The difference in brightness between two bands is referred to as color. On color–color diagrams, the color defined by two wavelength bands is plotted on the horizontal axis, and the color defined by another brightness difference will be plotted on the vertical axis. Background Although stars are not perfect blackbodies, to first order the spectra of light emitted by stars conforms closely to a black-body radiation curve, also referred to sometimes as a thermal radiation curve. The overall shape of a black-body curve is uniquely determined by its temperature, and the wavelength of peak intensity is inversely proportional to temperature, a relation known as Wien's Displacement Law. Thus, observation of a stellar spectrum allows ... [...More Info...] [...Related Items...] OR: [Wikipedia] [Google] [Baidu] |
Wavelength
In physics, the wavelength is the spatial period of a periodic wave—the distance over which the wave's shape repeats. It is the distance between consecutive corresponding points of the same phase on the wave, such as two adjacent crests, troughs, or zero crossings, and is a characteristic of both traveling waves and standing waves, as well as other spatial wave patterns. The inverse of the wavelength is called the spatial frequency. Wavelength is commonly designated by the Greek letter ''lambda'' (λ). The term ''wavelength'' is also sometimes applied to modulated waves, and to the sinusoidal envelopes of modulated waves or waves formed by interference of several sinusoids. Assuming a sinusoidal wave moving at a fixed wave speed, wavelength is inversely proportional to frequency of the wave: waves with higher frequencies have shorter wavelengths, and lower frequencies have longer wavelengths. Wavelength depends on the medium (for example, vacuum, air, or water) that a wav ... [...More Info...] [...Related Items...] OR: [Wikipedia] [Google] [Baidu] |
Stellar Classification
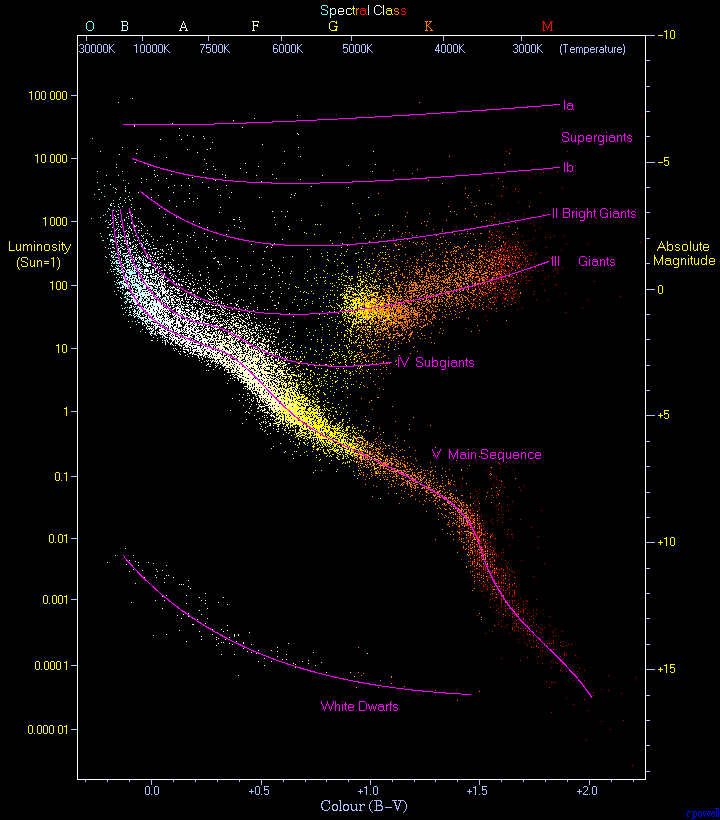
In astronomy, stellar classification is the classification of stars based on their stellar spectrum, spectral characteristics. Electromagnetic radiation from the star is analyzed by splitting it with a Prism (optics), prism or diffraction grating into a spectrum exhibiting the Continuum (spectrum), rainbow of colors interspersed with spectral lines. Each line indicates a particular chemical element or molecule, with the line strength indicating the abundance of that element. The strengths of the different spectral lines vary mainly due to the temperature of the photosphere, although in some cases there are true abundance differences. The ''spectral class'' of a star is a short code primarily summarizing the ionization state, giving an objective measure of the photosphere's temperature. Most stars are currently classified under the Morgan–Keenan (MK) system using the letters ''O'', ''B'', ''A'', ''F'', ''G'', ''K'', and ''M'', a sequence from the hottest (''O'' type) to the coo ... [...More Info...] [...Related Items...] OR: [Wikipedia] [Google] [Baidu] |
Binary Star
A binary star is a system of two stars that are gravitationally bound to and in orbit around each other. Binary stars in the night sky that are seen as a single object to the naked eye are often resolved using a telescope as separate stars, in which case they are called ''visual binaries''. Many visual binaries have long orbital periods of several centuries or millennia and therefore have orbits which are uncertain or poorly known. They may also be detected by indirect techniques, such as spectroscopy (''spectroscopic binaries'') or astrometry (''astrometric binaries''). If a binary star happens to orbit in a plane along our line of sight, its components will eclipse and transit each other; these pairs are called ''eclipsing binaries'', or, together with other binaries that change brightness as they orbit, ''photometric binaries''. If components in binary star systems are close enough they can gravitationally distort their mutual outer stellar atmospheres. In some cases, thes ... [...More Info...] [...Related Items...] OR: [Wikipedia] [Google] [Baidu] |
Subdwarf
A subdwarf, sometimes denoted by "sd", is a star with luminosity class VI under the Yerkes spectral classification system. They are defined as stars with luminosity 1.5 to 2 magnitudes lower than that of main-sequence stars of the same spectral type. On a Hertzsprung–Russell diagram subdwarfs appear to lie below the main sequence. The term "subdwarf" was coined by Gerard Kuiper in 1939, to refer to a series of stars with anomalous spectra that were previously labeled as "intermediate white dwarfs". Cool subdwarfs Like ordinary main-sequence stars, cool subdwarfs (of spectral types G to M) produce their energy from hydrogen fusion. The explanation of their underluminosity lies in their low metallicity: these stars are unenriched in elements heavier than helium. The lower metallicity decreases the opacity of their outer layers and decreases the radiation pressure, resulting in a smaller, hotter star for a given mass. This lower opacity also allows them to emit a higher percen ... [...More Info...] [...Related Items...] OR: [Wikipedia] [Google] [Baidu] |
Main Sequence
In astronomy, the main sequence is a continuous and distinctive band of stars that appears on plots of stellar color versus brightness. These color-magnitude plots are known as Hertzsprung–Russell diagrams after their co-developers, Ejnar Hertzsprung and Henry Norris Russell. Stars on this band are known as main-sequence stars or dwarf stars. These are the most numerous true stars in the universe and include the Sun. After condensation and ignition of a star, it generates thermal energy in its dense core region through nuclear fusion of hydrogen into helium. During this stage of the star's lifetime, it is located on the main sequence at a position determined primarily by its mass but also based on its chemical composition and age. The cores of main-sequence stars are in hydrostatic equilibrium, where outward thermal pressure from the hot core is balanced by the inward pressure of gravitational collapse from the overlying layers. The strong dependence of the rate of energy ge ... [...More Info...] [...Related Items...] OR: [Wikipedia] [Google] [Baidu] |
2 Micron All Sky Survey
The Two Micron All-Sky Survey, or 2MASS, was an astronomical survey of the whole sky in infrared light. It took place between 1997 and 2001, in two different locations: at the U.S. Fred Lawrence Whipple Observatory on Mount Hopkins, Arizona, and at the Cerro Tololo Inter-American Observatory in Chile, each using a 1.3-meter telescope for the Northern and Southern Hemisphere, respectively. It was conducted in the short-wavelength infrared at three distinct frequency bands ( J, H, and K) near 2 micrometres, from which the photometric survey with its HgCdTe detectors derives its name. 2MASS produced an astronomical catalog with over 300 million observed objects, including minor planets of the Solar System, brown dwarfs, low-mass stars, nebulae, star clusters and galaxies. In addition, 1 million objects were cataloged in the ''2MASS Extended Source Catalog'' (''2MASX''). The cataloged objects are designated with a "2MASS" and "2MASX"-prefix respectively. Catalog The final d ... [...More Info...] [...Related Items...] OR: [Wikipedia] [Google] [Baidu] |
Sloan Digital Sky Survey
The Sloan Digital Sky Survey or SDSS is a major multi-spectral imaging and spectroscopic redshift survey using a dedicated 2.5-m wide-angle optical telescope at Apache Point Observatory in New Mexico, United States. The project began in 2000 and was named after the Alfred P. Sloan Foundation, which contributed significant funding. A consortium of the University of Washington and Princeton University was established to conduct a redshift survey. The Astrophysical Research Consortium (ARC) was established in 1984 with the additional participation of New Mexico State University and Washington State University to manage activities at Apache Point. In 1991 the Sloan Foundation granted the ARC funding for survey efforts and the construction of equipment to carry out the work.. Background At the time of its design, the SDSS was a pioneering combination of novel instrumentation as well as data reduction and storage techniques that drove major advances in astronomical observations, di ... [...More Info...] [...Related Items...] OR: [Wikipedia] [Google] [Baidu] |
Monthly Notices Of The Royal Astronomical Society
''Monthly Notices of the Royal Astronomical Society'' (MNRAS) is a peer-reviewed scientific journal covering research in astronomy and astrophysics. It has been in continuous existence since 1827 and publishes letters and papers reporting original research in relevant fields. Despite the name, the journal is no longer monthly, nor does it carry the notices of the Royal Astronomical Society. History The first issue of MNRAS was published on 9 February 1827 as ''Monthly Notices of the Astronomical Society of London'' and it has been in continuous publication ever since. It took its current name from the second volume, after the Astronomical Society of London became the Royal Astronomical Society (RAS). Until 1960 it carried the monthly notices of the RAS, at which time these were transferred to the newly established ''Quarterly Journal of the Royal Astronomical Society'' (1960–1996) and then to its successor journal ''Astronomy & Geophysics'' (since 1997). Until 1965, MNRAS ... [...More Info...] [...Related Items...] OR: [Wikipedia] [Google] [Baidu] |
IRAS
The Infrared Astronomical Satellite (Dutch: ''Infrarood Astronomische Satelliet'') (IRAS) was the first space telescope to perform a survey of the entire night sky at infrared wavelengths. Launched on 25 January 1983, its mission lasted ten months. The telescope was a joint project of the United States (NASA), the Netherlands ( NIVR), and the United Kingdom ( SERC). Over 250,000 infrared sources were observed at 12, 25, 60, and 100 micrometer wavelengths. Support for the processing and analysis of data from IRAS was contributed from the Infrared Processing and Analysis Center at the California Institute of Technology. Currently, the Infrared Science Archive at IPAC holds the IRAS archive. The success of IRAS led to interest in the 1985 Infrared Telescope (IRT) mission on the Space Shuttle, and the planned Shuttle Infrared Telescope Facility which eventually transformed into the Space Infrared Telescope Facility, SIRTF, which in turn was developed into the Spitzer Space ... [...More Info...] [...Related Items...] OR: [Wikipedia] [Google] [Baidu] |
Extinction (astronomy)
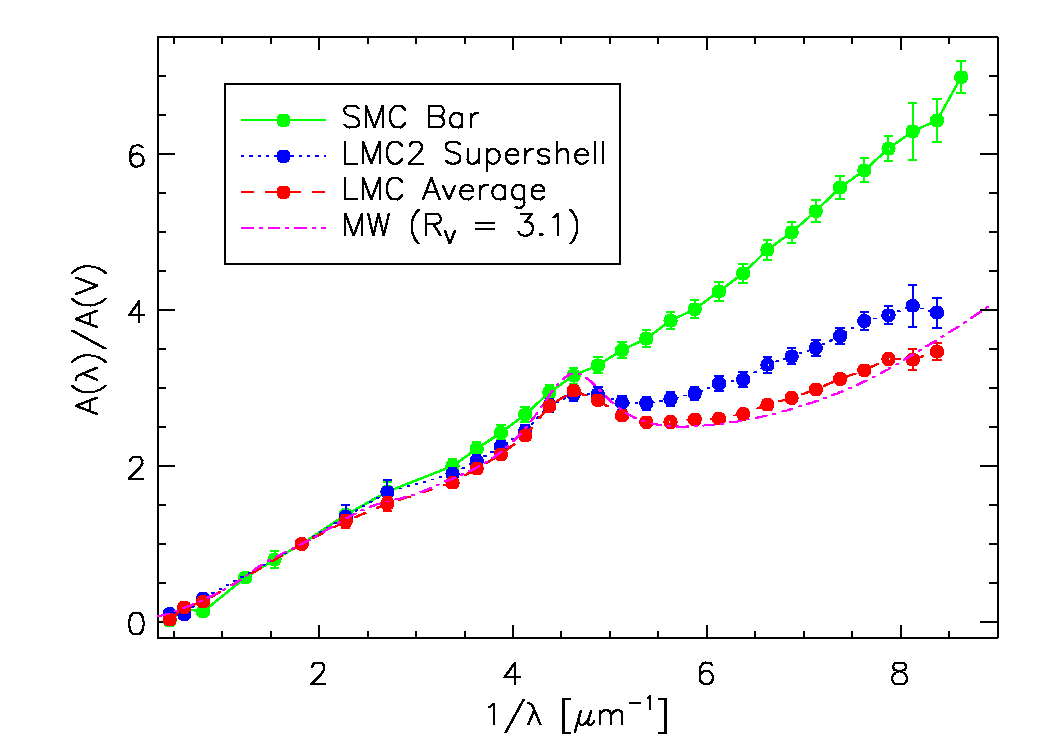
In astronomy, extinction is the absorption and scattering of electromagnetic radiation by dust and gas between an emitting astronomical object and the observer. Interstellar extinction was first documented as such in 1930 by Robert Julius Trumpler. However, its effects had been noted in 1847 by Friedrich Georg Wilhelm von Struve, and its effect on the colors of stars had been observed by a number of individuals who did not connect it with the general presence of galactic dust. For stars that lie near the plane of the Milky Way and are within a few thousand parsecs of the Earth, extinction in the visual band of frequencies (photometric system) is roughly 1.8 magnitudes per kiloparsec. For Earth-bound observers, extinction arises both from the interstellar medium (ISM) and the Earth's atmosphere; it may also arise from circumstellar dust around an observed object. Strong extinction in earth's atmosphere of some wavelength regions (such as X-ray, ultraviolet, and infrared ... [...More Info...] [...Related Items...] OR: [Wikipedia] [Google] [Baidu] |
Galaxy Clusters
A galaxy cluster, or a cluster of galaxies, is a structure that consists of anywhere from hundreds to thousands of galaxies that are bound together by gravity, with typical masses ranging from 1014 to 1015 solar masses. They are the second-largest known gravitationally bound structures in the universe after galaxy filaments and were believed to be the largest known structures in the universe until the 1980s, when superclusters were discovered. One of the key features of clusters is the intracluster medium (ICM). The ICM consists of heated gas between the galaxies and has a peak temperature between 2–15 keV that is dependent on the total mass of the cluster. Galaxy clusters should not be confused with ''galactic clusters'' (also known as open clusters), which are star clusters ''within'' galaxies, or with globular clusters, which typically orbit galaxies. Small aggregates of galaxies are referred to as galaxy groups rather than clusters of galaxies. The galaxy groups and clus ... [...More Info...] [...Related Items...] OR: [Wikipedia] [Google] [Baidu] |
South Pole Telescope
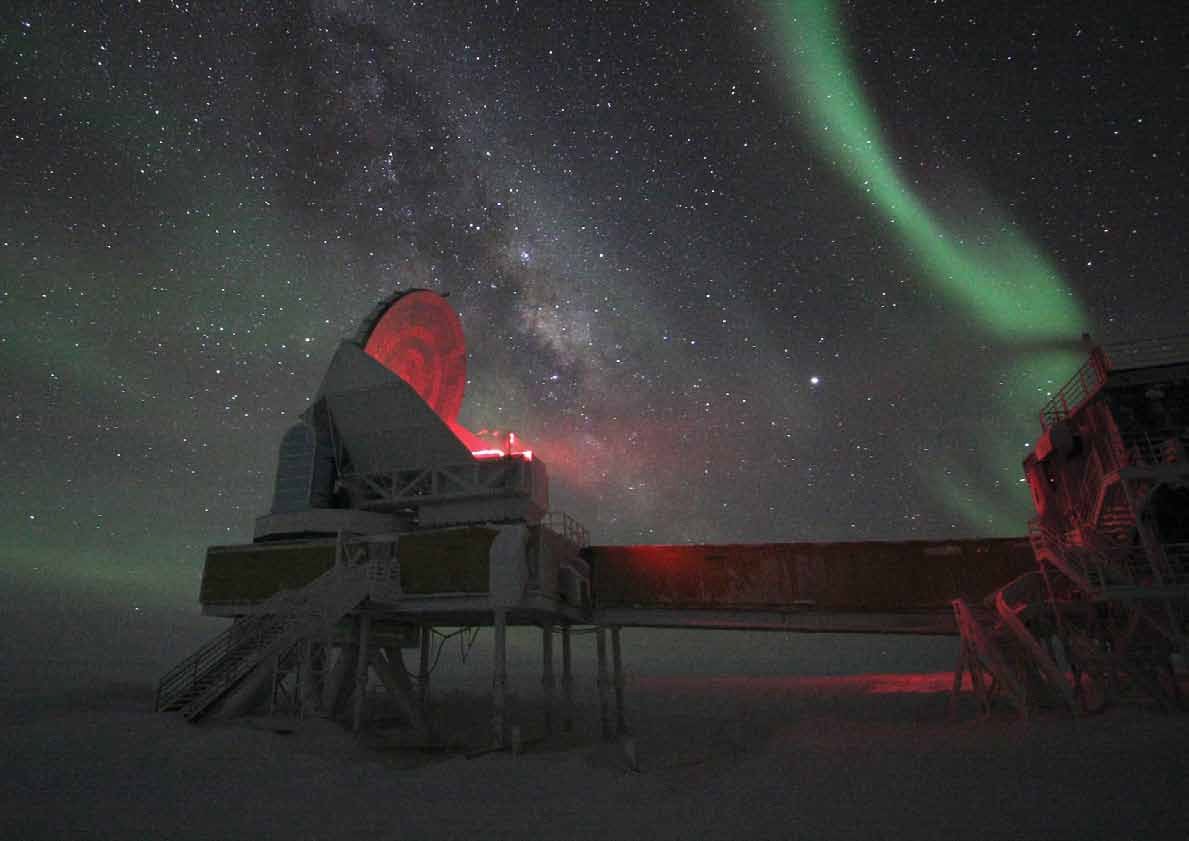
The South Pole Telescope (SPT) is a diameter telescope located at the Amundsen–Scott South Pole Station, Antarctica. The telescope is designed for observations in the microwave, millimeter-wave, and submillimeter-wave regions of the electromagnetic spectrum, with the particular design goal of measuring the faint, diffuse emission from the cosmic microwave background (CMB). The first major survey with the SPT—designed to find distant, massive, clusters of galaxies through their interaction with the CMB, with the goal of constraining the dark energy equation of state—was completed in October 2011. In early 2012, a new camera (SPTpol) was installed on the SPT with even greater sensitivity and the capability to measure the polarization of incoming light. This camera operated from 2012–2016 and was used to make unprecedentedly deep high-resolution maps of hundreds of square degrees of the Southern sky. In 2017, the third-generation camera SPT-3G was installed on the teles ... [...More Info...] [...Related Items...] OR: [Wikipedia] [Google] [Baidu] |


