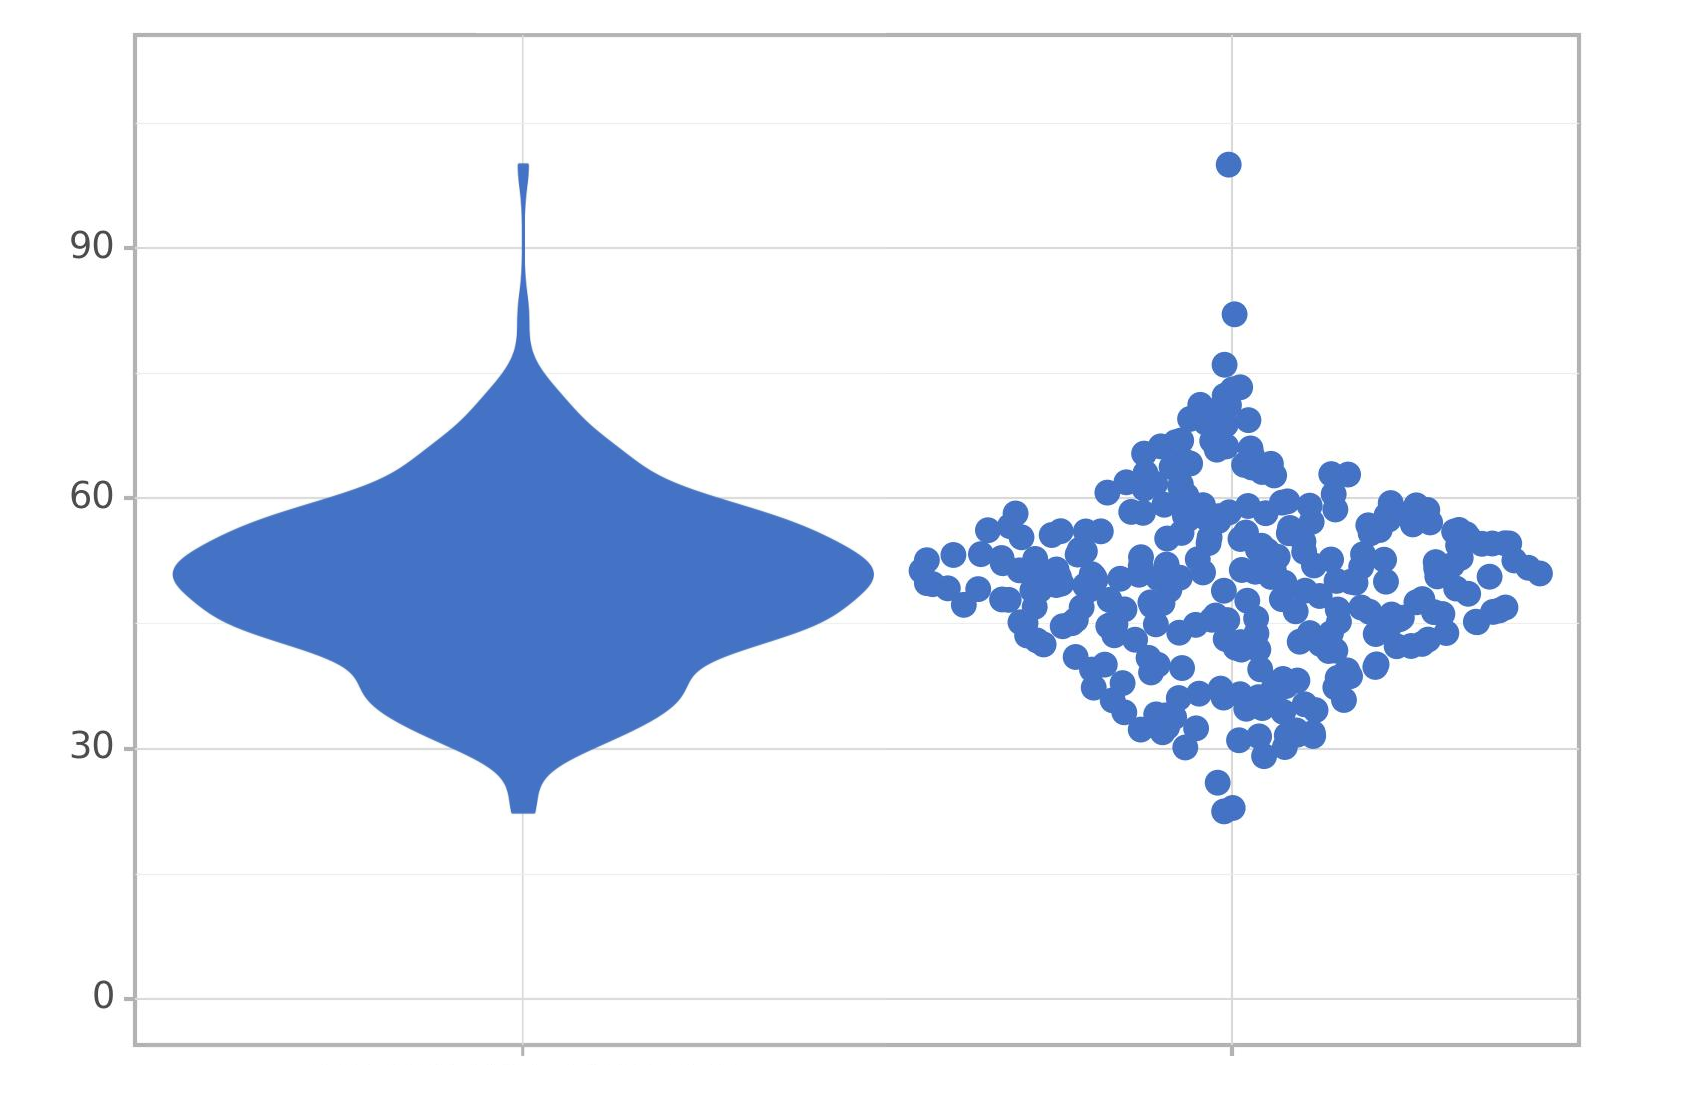
Sina Plot on:
[Wikipedia]
[Google]
[Amazon]
 A sina plot is a type of diagram in which numerical data are depicted by points distributed in such a way that the width of the point distribution is proportional to the kernel density. Sina plots are similar to
 A sina plot is a type of diagram in which numerical data are depicted by points distributed in such a way that the width of the point distribution is proportional to the kernel density. Sina plots are similar to
 violin plot
The violin, sometimes referred to as a fiddle, is a wooden chordophone, and is the smallest, and thus highest-pitched instrument (soprano) in regular use in the violin family. Smaller violin-type instruments exist, including the violino pic ...
s, but while violin plots depict kernel density, sina plots depict the points themselves. In some situations, sina plots may be preferable to violin plots, because sina plots contain more information.
The term "sina plot" is intended to recognize the contributions of Sina Hadi Sohi, a student at the University of Copenhagen in Denmark. Sina created the original code that researchers at the university used to generate these plots.
There are a number of ways to create sina plots, in particular:
* The ggplot2
ggplot2 is an open-source data visualization R package, package for the Computational statistics, statistical programming language R (programming language), R. Created by Hadley Wickham in 2005, ggplot2 is an implementation of Leland Wilkinson ...
library of the R programming language
R is a programming language for statistical computing and data visualization. It has been widely adopted in the fields of data mining, bioinformatics, data analysis, and data science.
The core R language is extended by a large number of so ...
used together with the ggforce package.
* The sinaplot library of the R programming language.
* The plotnine library of the Python programming language
Python is a high-level, general-purpose programming language. Its design philosophy emphasizes code readability with the use of significant indentation.
Python is dynamically type-checked and garbage-collected. It supports multiple prog ...
.https://plotnine.readthedocs.io/en/stable/generated/plotnine.geoms.geom_sina.html
See also
*Violin plot
The violin, sometimes referred to as a fiddle, is a wooden chordophone, and is the smallest, and thus highest-pitched instrument (soprano) in regular use in the violin family. Smaller violin-type instruments exist, including the violino pic ...
* Box plot
In descriptive statistics, a box plot or boxplot is a method for demonstrating graphically the locality, spread and skewness groups of numerical data through their quartiles.
In addition to the box on a box plot, there can be lines (which are ca ...
References
{{Statistics Statistical charts and diagrams