|
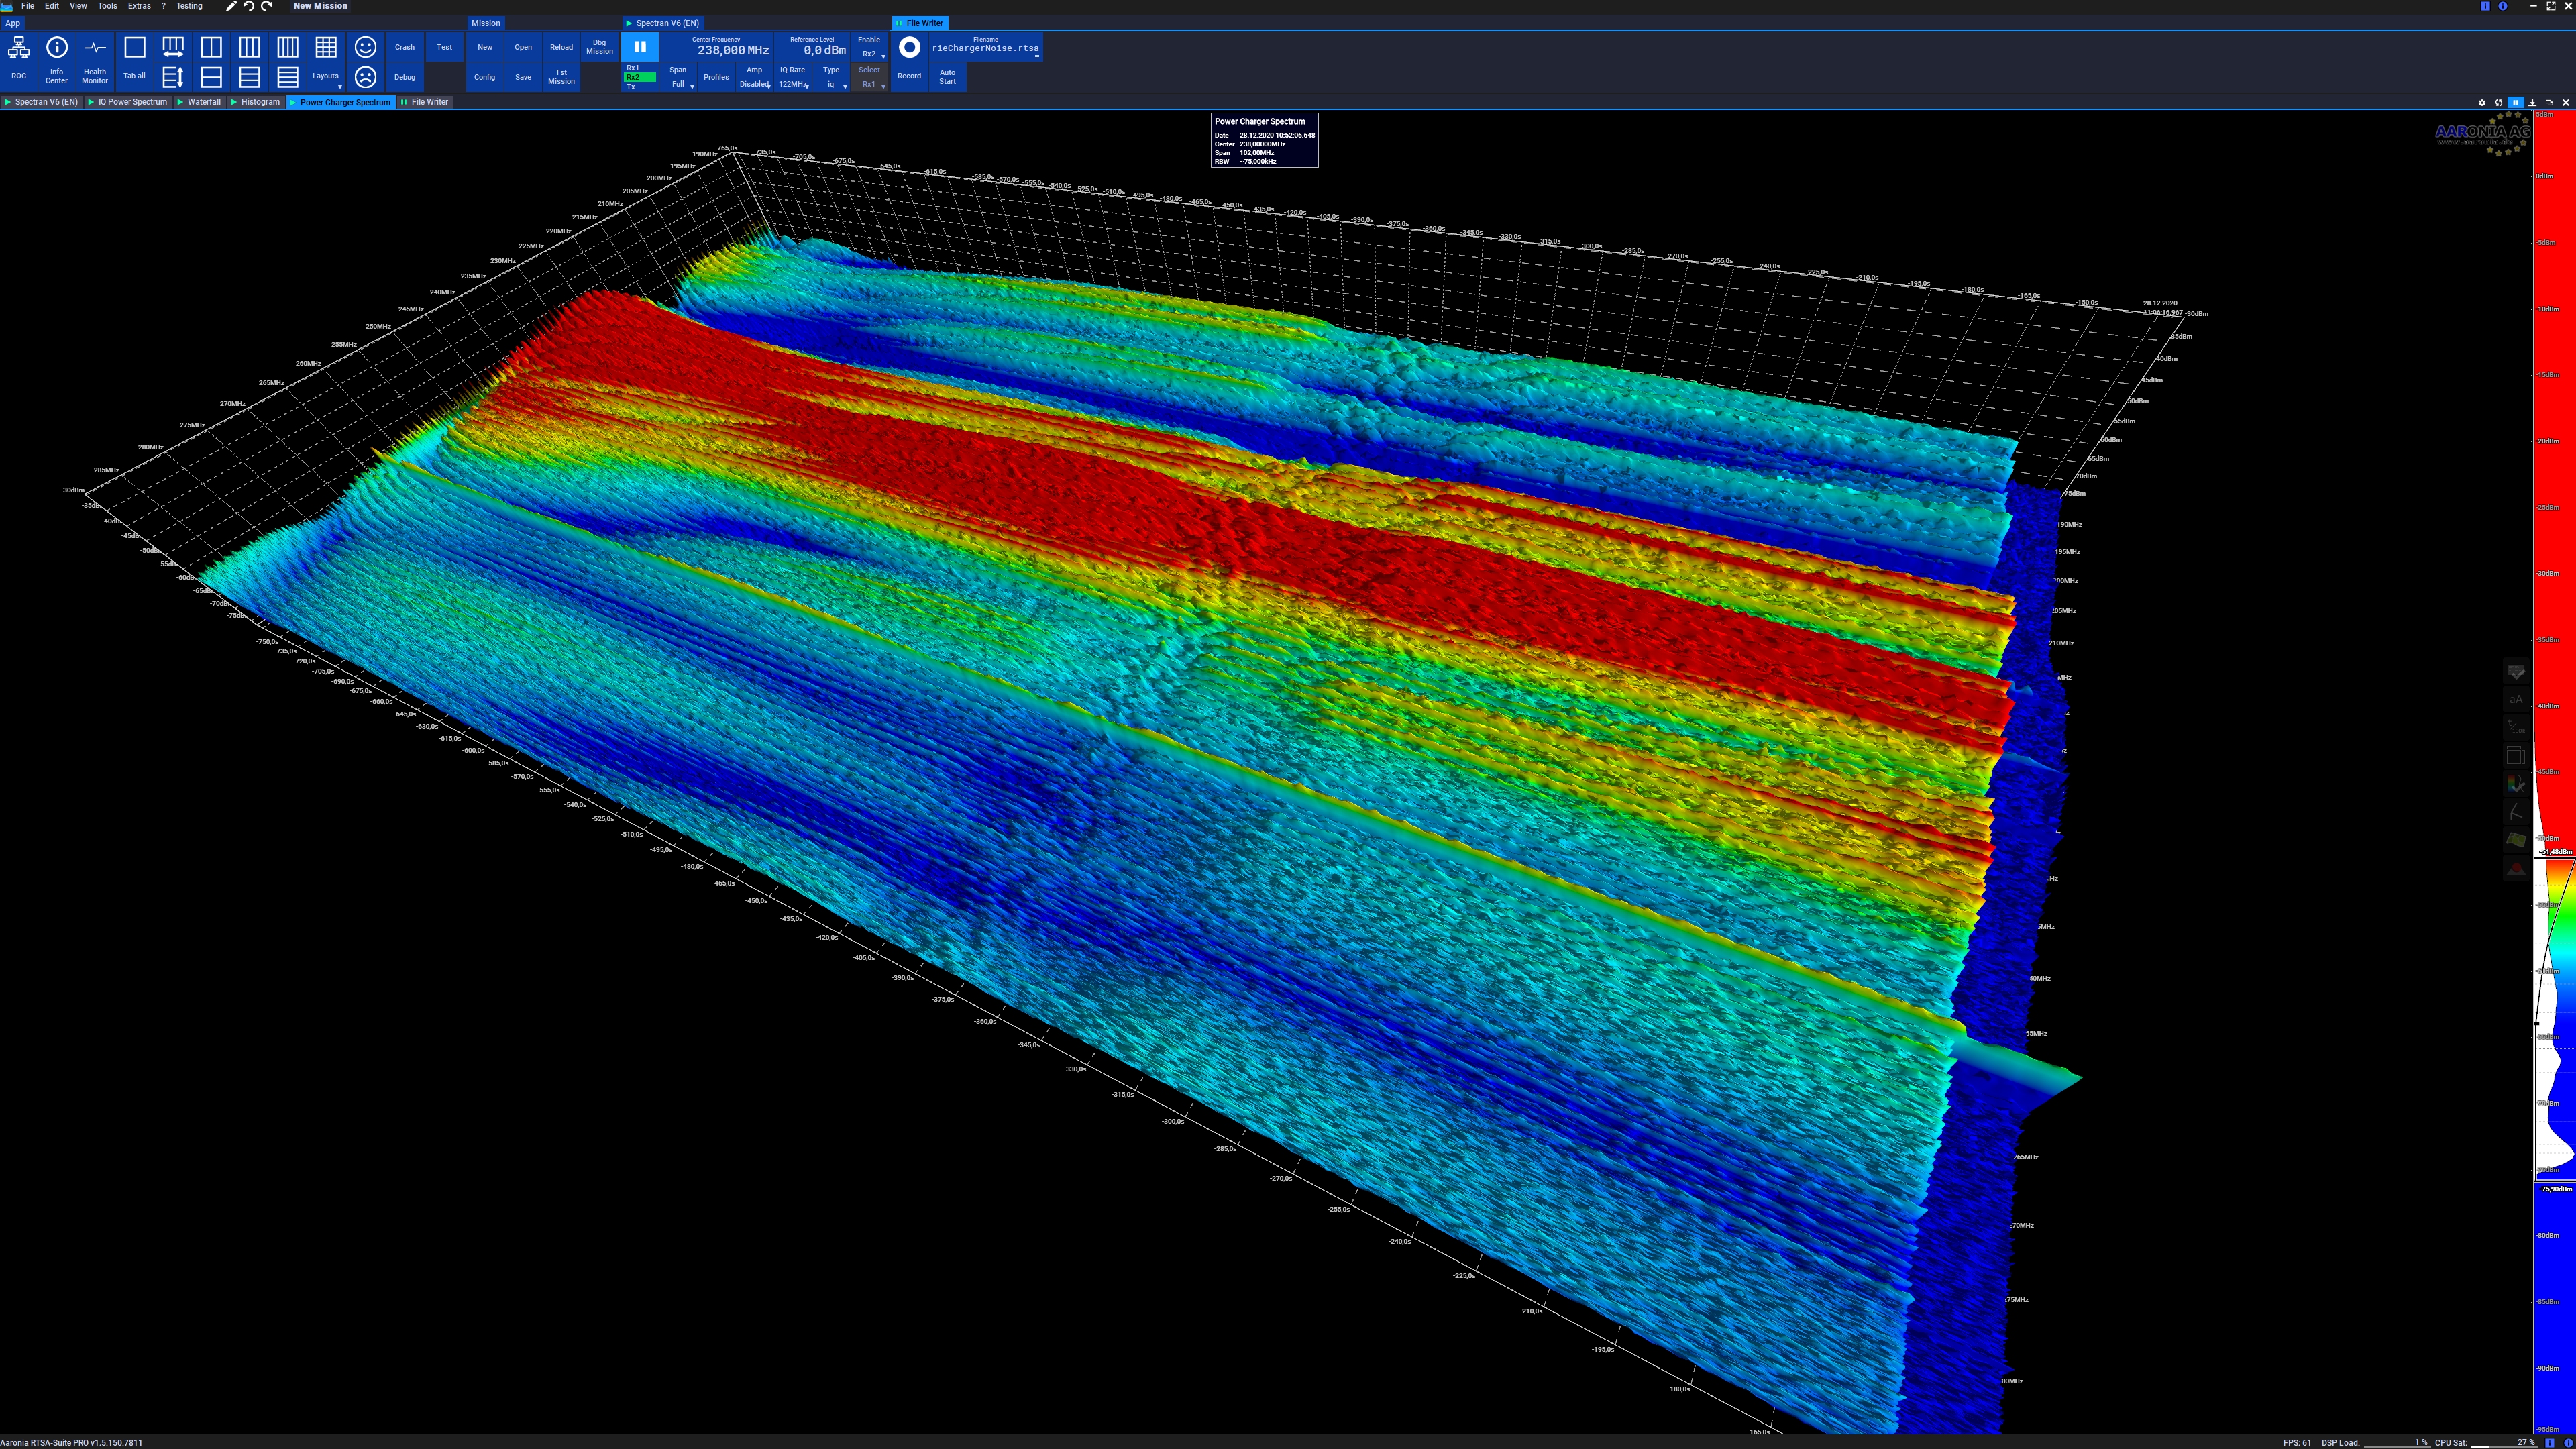
Waterfall Plot
Waterfall plots are often used to show how two-dimensional phenomena change over time. A three-dimensional ''spectral waterfall plot'' is a plot in which multiple curves of data, typically spectra, are displayed simultaneously. Typically the curves are staggered both across the screen and vertically, with "nearer" curves masking the ones behind. The result is a series of "mountain" shapes that appear to be side by side. The waterfall plot is often used to show how two-dimensional information changes over time or some other variable such as rotational speed. Waterfall plots are also often used to depict '' spectrograms'' or ''cumulative spectral decay'' (CSD). Uses * The results of spectral density estimation, showing the spectrum of the signal at successive intervals of time. * The delayed response from a loudspeaker or listening room produced by impulse response In signal processing and control theory, the impulse response, or impulse response function (IRF), of a dynamic ... [...More Info...] [...Related Items...] OR: [Wikipedia] [Google] [Baidu] |
Spectrogram
A spectrogram is a visual representation of the spectrum of frequencies of a signal as it varies with time. When applied to an audio signal, spectrograms are sometimes called sonographs, voiceprints, or voicegrams. When the data are represented in a 3D plot they may be called '' waterfall displays''. Spectrograms are used extensively in the fields of music, linguistics, sonar, radar, speech processing, seismology, and others. Spectrograms of audio can be used to identify spoken words phonetically, and to analyse the various calls of animals. A spectrogram can be generated by an optical spectrometer, a bank of band-pass filters, by Fourier transform or by a wavelet transform (in which case it is also known as a scaleogram or scalogram). A spectrogram is usually depicted as a heat map, i.e., as an image with the intensity shown by varying the colour or brightness. Format A common format is a graph with two geometric dimensions: one axis represents time, and the other ... [...More Info...] [...Related Items...] OR: [Wikipedia] [Google] [Baidu] |
