Van Genuchten–Gupta model on:
[Wikipedia]
[Google]
[Amazon]
The Van Genuchten–Gupta model is an inverted S-curve applicable to 
 As an alternative, the '' logistic S-function'' can be used.
The mathematical expression is:
:
where:
:
with ''Y'' being the yield, ''Y''n the minimum ''Y'', ''Y''m the maximum ''Y'', ''X'' the salt concentration of the soil, while ''A'', ''B'' and ''C'' are constants to be determined by
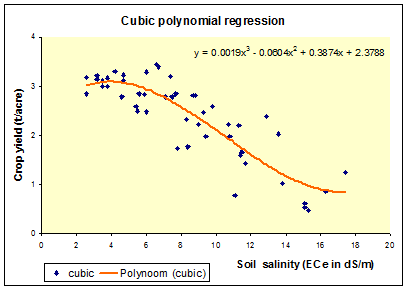
 The third degree or '' cubic regression'' also offers a useful alternative.
The equation reads:
:
with ''Y'' the yield, ''X'' the salt concentration of the soil, while ''A'', ''B'', ''C'' and ''D'' are constants to be determined by the regression.
In the figure: ''A'' = 0.0017, ''B'' = 0.0604, ''C=''0.3874, ''D'' = 2.3788. These values were calculated with
crop yield
In agriculture, the yield is a measurement of the amount of a crop grown, or product such as wool, meat or milk produced, per unit area of land. The seed ratio is another way of calculating yields.
Innovations, such as the use of fertilizer, the ...
and soil salinity
Soil salinity is the salt (chemistry), salt content in the soil; the process of increasing the salt content is known as salinization (also called salination in American and British English spelling differences, American English). Salts occur nat ...
relations.M. Th. van Genuchten and S.K. Gupta, 1993. USDA-ARS, U.S. Salinity Laboratory 4500 Glenwood Drive, Riverside, California, USA, 92501. ''A reassessment of the Crop Tolerance Response Function.'' Journal of the Indian Society of Soil Science, Vol. 41, No. 4, pp 730–737. It is named after Martinus Theodore van Genuchten and Satyandra K. Gupta
Dr. Satyandra K. Gupta is a researcher and educator working in the field of automation and robotics. He started his career as a Research Scientist
in the Robotics Institute at Carnegie Mellon University in 1995. He moved to the University of Mary ...
's work from the 1990s.

Equation
The mathematical expression is: : where ''Y'' is the yield, ''Y''m is the maximum yield of the model, ''C'' is salt concentration of the soil, ''C''50 is the ''C'' value at 50% yield, and ''P'' is an exponent to be found byoptimization
Mathematical optimization (alternatively spelled ''optimisation'') or mathematical programming is the selection of a best element, with regard to some criteria, from some set of available alternatives. It is generally divided into two subfiel ...
and maximizing the model's goodness of fit
The goodness of fit of a statistical model describes how well it fits a set of observations. Measures of goodness of fit typically summarize the discrepancy between observed values and the values expected under the model in question. Such measur ...
to the data.
In the figure: ''Y''m = 3.1, ''C''50 = 12.4, ''P'' = 3.75
Alternative one
 As an alternative, the '' logistic S-function'' can be used.
The mathematical expression is:
:
where:
:
with ''Y'' being the yield, ''Y''n the minimum ''Y'', ''Y''m the maximum ''Y'', ''X'' the salt concentration of the soil, while ''A'', ''B'' and ''C'' are constants to be determined by
 optimization
Mathematical optimization (alternatively spelled ''optimisation'') or mathematical programming is the selection of a best element, with regard to some criteria, from some set of available alternatives. It is generally divided into two subfiel ...
and maximizing the model's goodness of fit
The goodness of fit of a statistical model describes how well it fits a set of observations. Measures of goodness of fit typically summarize the discrepancy between observed values and the values expected under the model in question. Such measur ...
to the data.
If the minimum ''Y''n=0 then the expression can be simplified to:
:
In the figure: ''Y''m = 3.43, ''Y''n = 0.47, ''A'' = 0.112, ''B'' = -3.16, ''C'' = 1.42.
Alternative two
 The third degree or '' cubic regression'' also offers a useful alternative.
The equation reads:
:
with ''Y'' the yield, ''X'' the salt concentration of the soil, while ''A'', ''B'', ''C'' and ''D'' are constants to be determined by the regression.
In the figure: ''A'' = 0.0017, ''B'' = 0.0604, ''C=''0.3874, ''D'' = 2.3788. These values were calculated with
 Microsoft Excel
Microsoft Excel is a spreadsheet editor developed by Microsoft for Microsoft Windows, Windows, macOS, Android (operating system), Android, iOS and iPadOS. It features calculation or computation capabilities, graphing tools, pivot tables, and a ...
The curvature is more pronounced than in the other models.
See also
* Maas–Hoffman modelReferences
Soil science Mathematical modeling Crops {{soil-sci-stub