 The Observatory of Economic Complexity (OEC) is a data visualization site for international trade data created by the Macro Connections group at the
 MIT Media Lab
The MIT Media Lab is a research laboratory at the Massachusetts Institute of Technology, growing out of MIT's Architecture Machine Group in the School of Architecture. Its research does not restrict to fixed academic disciplines, but draws from ...
. The goal of the observatory is to distribute international trade data in a visual form. At present the observatory serves more than 20 million interactive visualizations, connecting hundreds of countries to their export destinations and to the products that they trade.
Source data
The Observatory of Economic Complexity combines a number of international trade data sets, including data from Feenstra, Lipset, Deng, Ma, and Mo's ''World Trade Flows: 1962-2000'' dataset, cleaned and made compatible through a National Bureau of Economic Research (NBER) project and HS4 aggregated from the HS6 classification cleaned by the BACI team at Centre d'Etudes Prospectives et d'Informations Internationales (CEPII). The dataset contains exports and imports both by country of origin and by destination. Products are disaggregated according to the Standardized International Trade Code at the four-digit level (SITC-4) and the Harmonized Systems at the four digit level (HS-4). Currently, data is available from 1962 through 2019.Visualizations
* Tree Maps ]
Products, represented by rectangles, are drawn from the 775 individual product classes found in the Standardized International Trade Code at the four-digit level (SITC-4). The rectangle's color corresponds to the 34 product communities found in
 the Product Space
The Product Space is a network that formalizes the idea of relatedness between products traded in the global economy. The network first appeared in the July 2007 issue of ''Science'' in the article "The Product Space Conditions the Development ...
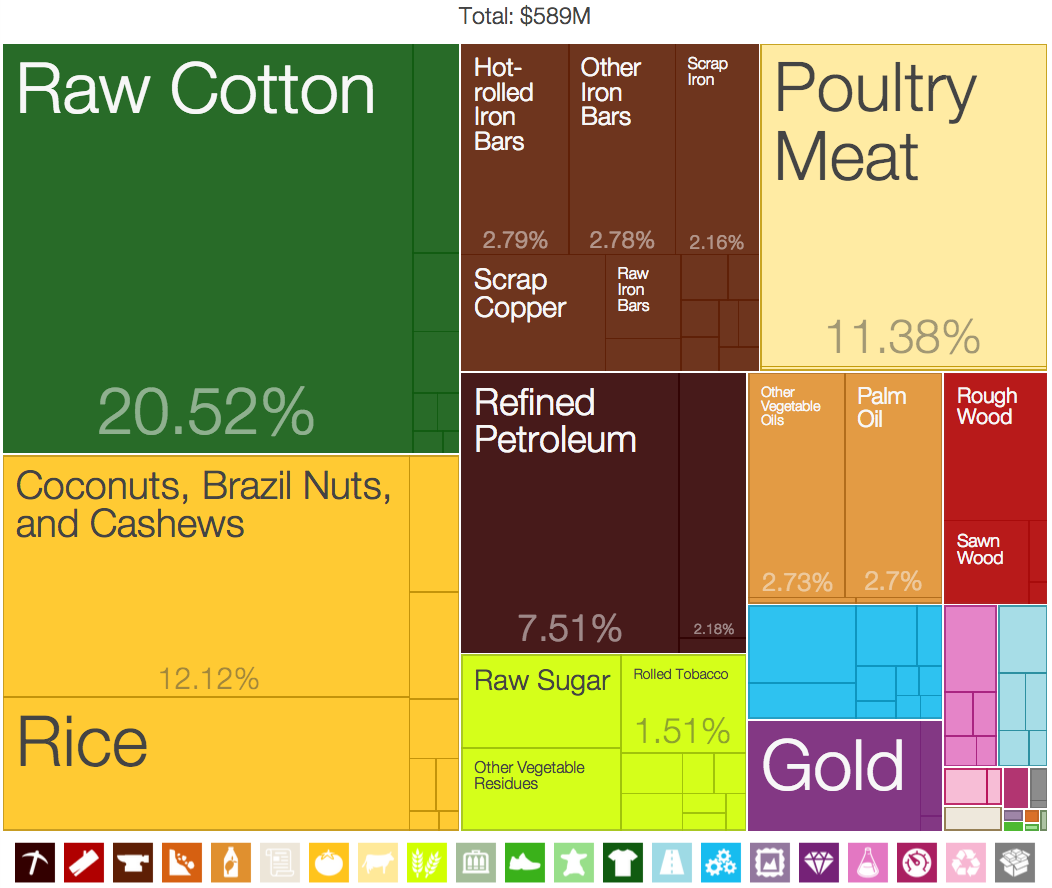
and other visualizations from The Observatory of Economic Complexity. Product Exports Treemaps in The Observatory of Economic Complexity graphically represent product's share of a nation's trade (imports or exports). The larger the size of the rectangle, the larger the product's share of that country's imports or exports.
An example from Benin
Benin ( , ; french: Bénin , ff, Benen), officially the Republic of Benin (french: République du Bénin), and formerly Dahomey, is a country in West Africa. It is bordered by Togo to the west, Nigeria to the east, Burkina Faso to the nort ...
in 2009 is shown on the right.
Additional visual representations include
* Stacked Area Charts
* The Product Space
The Product Space is a network that formalizes the idea of relatedness between products traded in the global economy. The network first appeared in the July 2007 issue of ''Science'' in the article "The Product Space Conditions the Development ...
* Predictive Tools
* Maps
* Rings
D3plus is the underlying engine responsible for generating all of the visualization used on the site. D3plus is an open source (MIT license) JavaScript
JavaScript (), often abbreviated as JS, is a programming language that is one of the core technologies of the World Wide Web, alongside HTML and CSS. As of 2022, 98% of Website, websites use JavaScript on the Client (computing), client side ...
library built on top of D3.js by Alexander Simoes and Dave Landry. It is also used on other visualization themed sites such as DataViva and Pantheon.
See also
* Complexity economics * Economic Complexity Index * List of countries by economic complexityReferences
External links
* * {{DEFAULTSORT:Observatory of Economic Complexity International trade Complexity economics Massachusetts Institute of Technology publications Economics websites