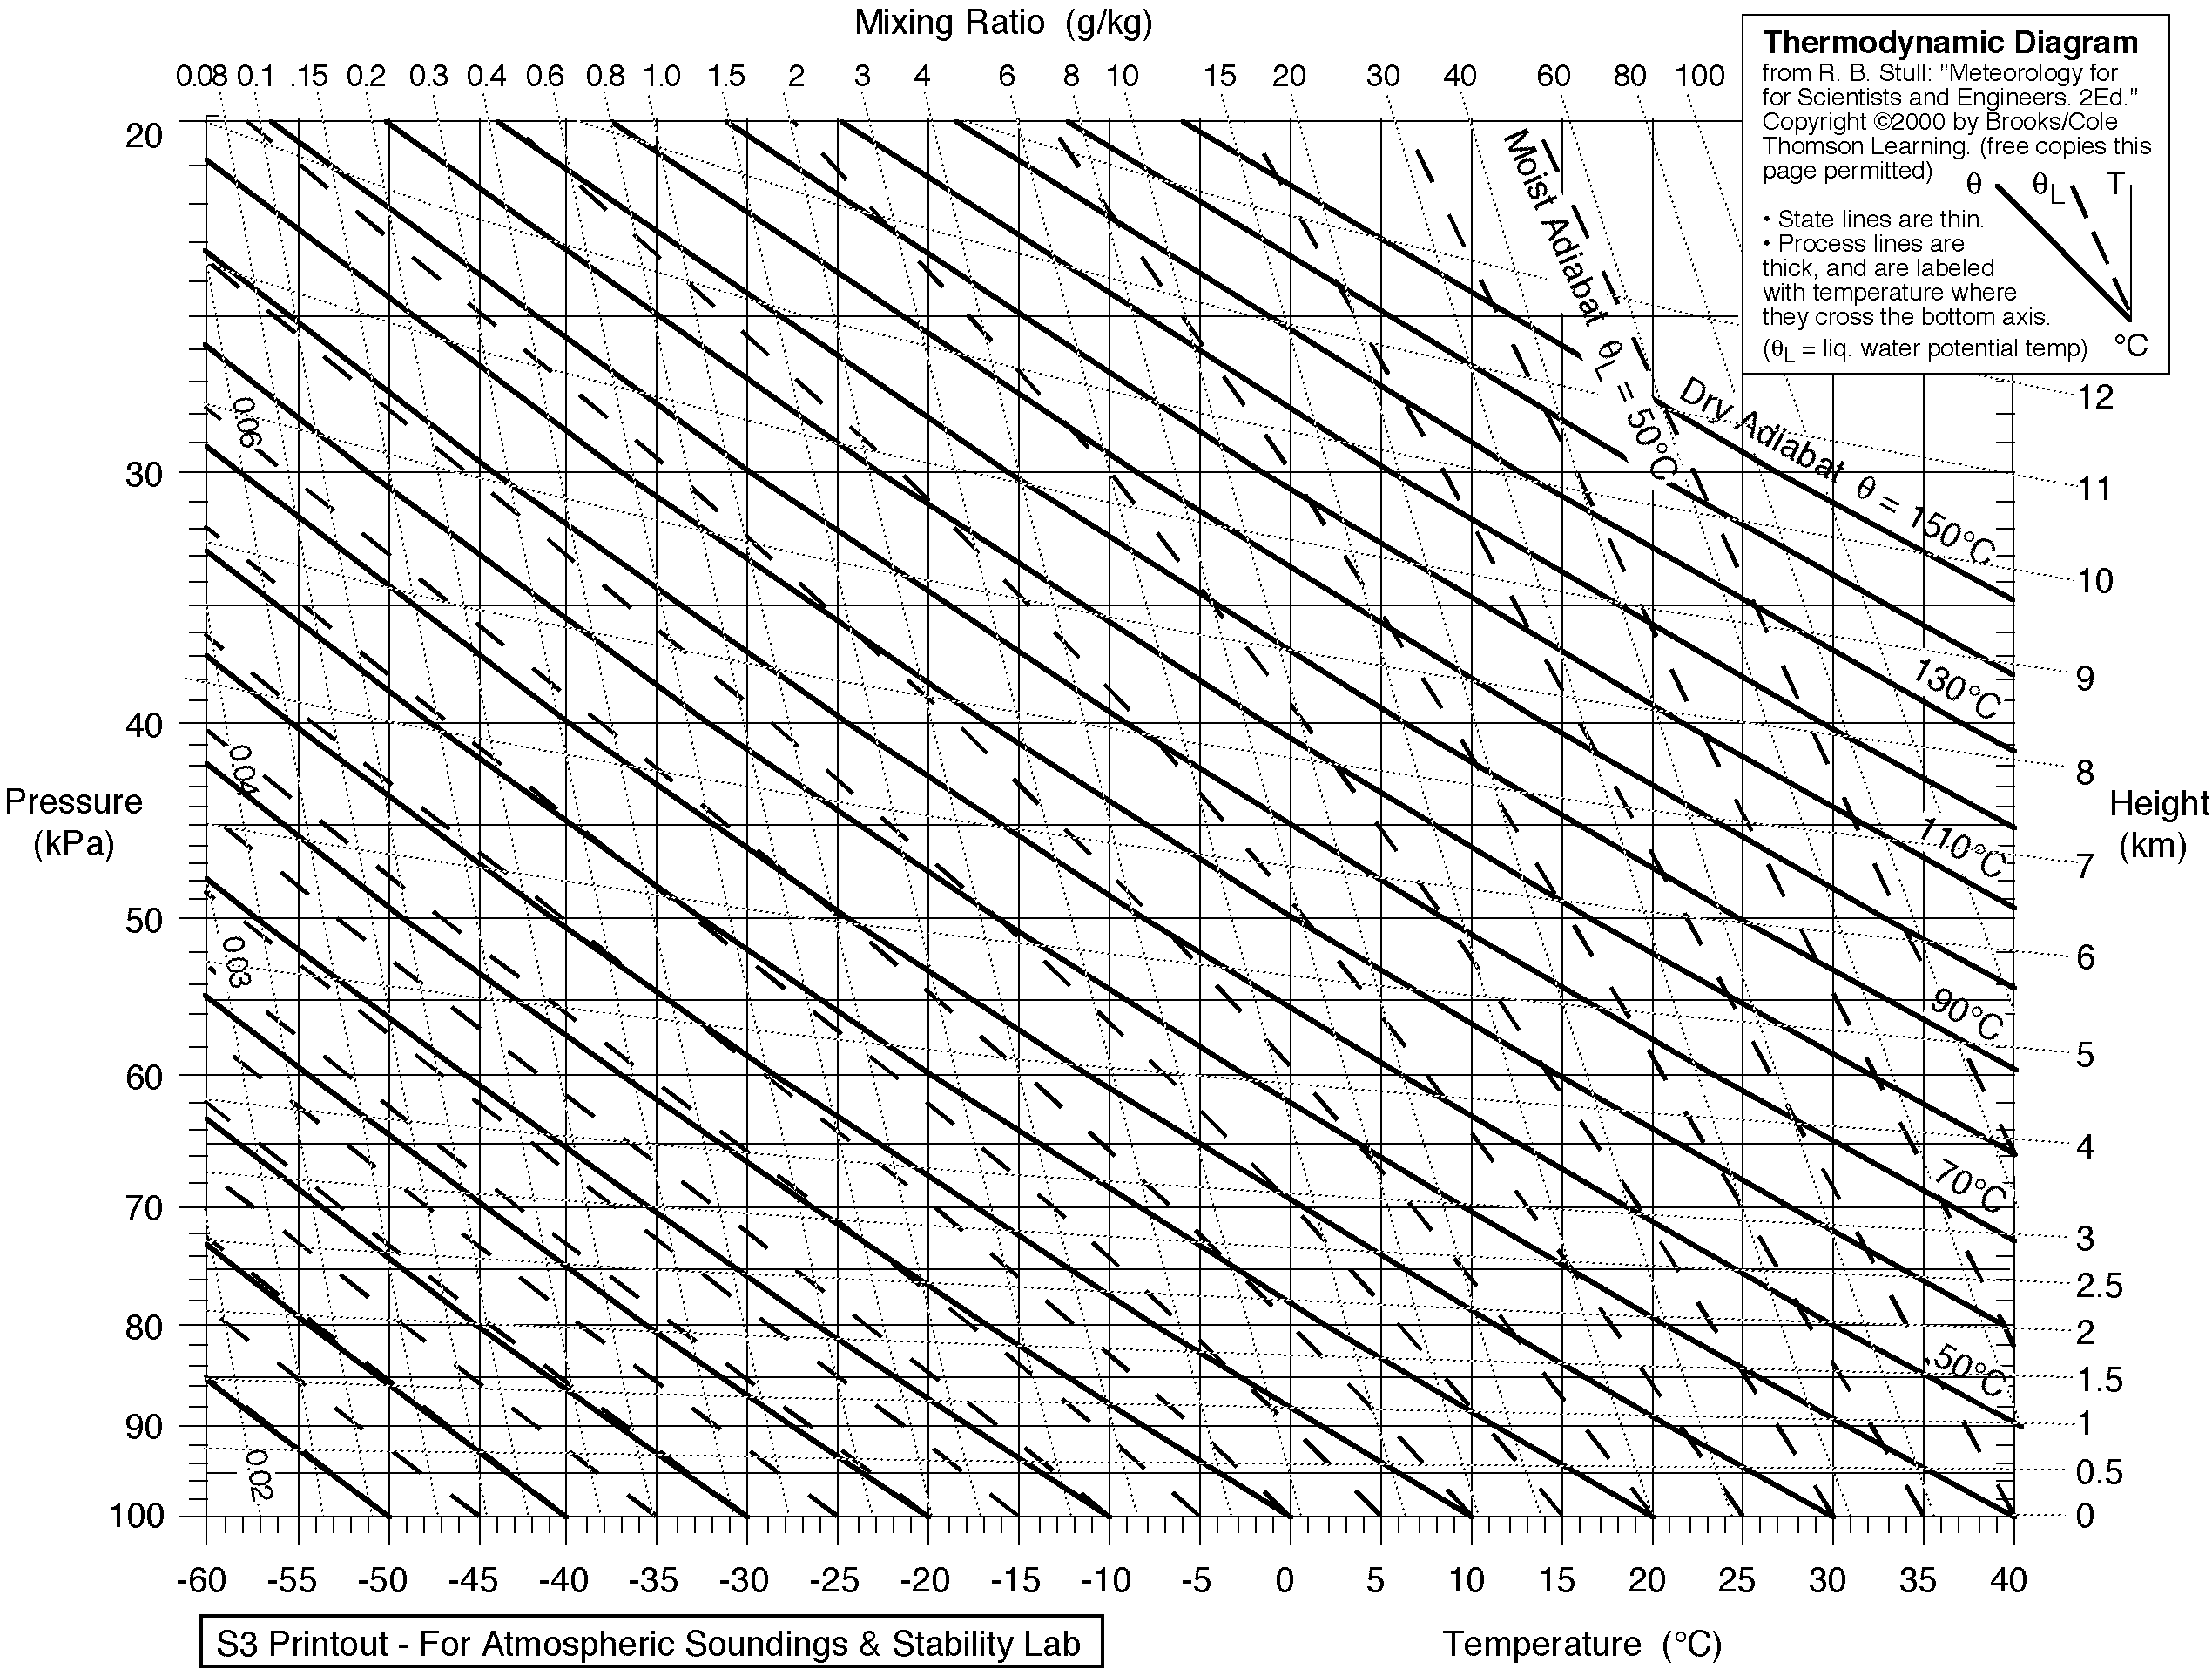
Emagram on:
[Wikipedia]
[Google]
[Amazon]
 An emagram is one of four
Thermodynamic diagrams
thermodynamic diagrams
Thermodynamic diagrams are diagrams used to represent the thermodynamic states of a material (typically fluid) and the consequences of manipulating this material. For instance, a temperature–entropy diagram ( T–s diagram) may be used to demon ...
used to display temperature lapse rate
The lapse rate is the rate at which an atmospheric variable, normally temperature in Earth's atmosphere, falls with altitude. ''Lapse rate'' arises from the word ''lapse'', in the sense of a gradual fall. In dry air, the adiabatic lapse rate is ...
and moisture content profiles in the atmosphere. The emagram has axes of temperature
Temperature is a physical quantity that expresses quantitatively the perceptions of hotness and coldness. Temperature is measured with a thermometer.
Thermometers are calibrated in various temperature scales that historically have relied o ...
(T) and pressure
Pressure (symbol: ''p'' or ''P'') is the force applied perpendicular to the surface of an object per unit area over which that force is distributed. Gauge pressure (also spelled ''gage'' pressure)The preferred spelling varies by country and e ...
(p). In the emagram, the dry adiabats make an angle of about 45 degrees with the isobars, isotherms are vertical and isopleths
A contour line (also isoline, isopleth, or isarithm) of a function of two variables is a curve along which the function has a constant value, so that the curve joins points of equal value. It is a plane section of the three-dimensional graph ...
of saturation mixing ratio are almost straight and vertical.
Usually, temperature
Temperature is a physical quantity that expresses quantitatively the perceptions of hotness and coldness. Temperature is measured with a thermometer.
Thermometers are calibrated in various temperature scales that historically have relied o ...
and dew point
The dew point is the temperature to which air must be cooled to become saturated with water vapor, assuming constant air pressure and water content. When cooled below the dew point, moisture capacity is reduced and airborne water vapor will cond ...
data from radiosonde
A radiosonde is a battery-powered telemetry instrument carried into the atmosphere usually by a weather balloon that measures various atmospheric parameters and transmits them by radio to a ground receiver. Modern radiosondes measure or calcula ...
s are plotted on these diagrams to allow calculations of convective stability or Convective Available Potential Energy
In meteorology, convective available potential energy (commonly abbreviated as CAPE), is the integrated amount of work that the upward (positive) buoyancy force would perform on a given mass of air (called an air parcel) if it rose vertically thr ...
. Wind barbs are often plotted at the side of a tephigram to indicate the winds at different heights.
First devised in 1884 by Heinrich Hertz
Heinrich Rudolf Hertz ( ; ; 22 February 1857 – 1 January 1894) was a German physicist who first conclusively proved the existence of the electromagnetic waves predicted by James Clerk Maxwell's Maxwell's equations, equations of electrom ...
, the emagram is used primarily in Europe
Europe is a large peninsula conventionally considered a continent in its own right because of its great physical size and the weight of its history and traditions. Europe is also considered a Continent#Subcontinents, subcontinent of Eurasia ...
an countries. Other countries use similar thermodynamic diagrams for the same purpose. However, the details of their construction vary. Emagram is the first atmospheric thermodynamic diagram.
See also
*Thermodynamic diagrams
Thermodynamic diagrams are diagrams used to represent the thermodynamic states of a material (typically fluid) and the consequences of manipulating this material. For instance, a temperature–entropy diagram ( T–s diagram) may be used to demon ...
*Skew-T log-P diagram
A skew-T log-P diagram is one of four thermodynamic diagrams commonly used in weather analysis and forecasting. In 1947, N. Herlofson proposed a modification to the emagram that allows straight, horizontal isobars and provides for a large angle ...
*Tephigram
A tephigram is one of four thermodynamic diagrams commonly used in weather analysis and forecasting. The name evolved from the original name "T-\phi-gram" to describe the axes of temperature (T) and entropy (\phi) used to create the plot. Usuall ...
*Stüve diagram
A Stüve diagram is one of four thermodynamic diagrams commonly used in weather analysis and forecasting.
It was developed circa 1927 by the German meteorologist Georg Stüve (1888–1935) and quickly gained widespread acceptance in the United St ...
References
Thermodynamic diagrams
Bibliography
* * Atmospheric thermodynamics {{climate-stub