|
Genogram
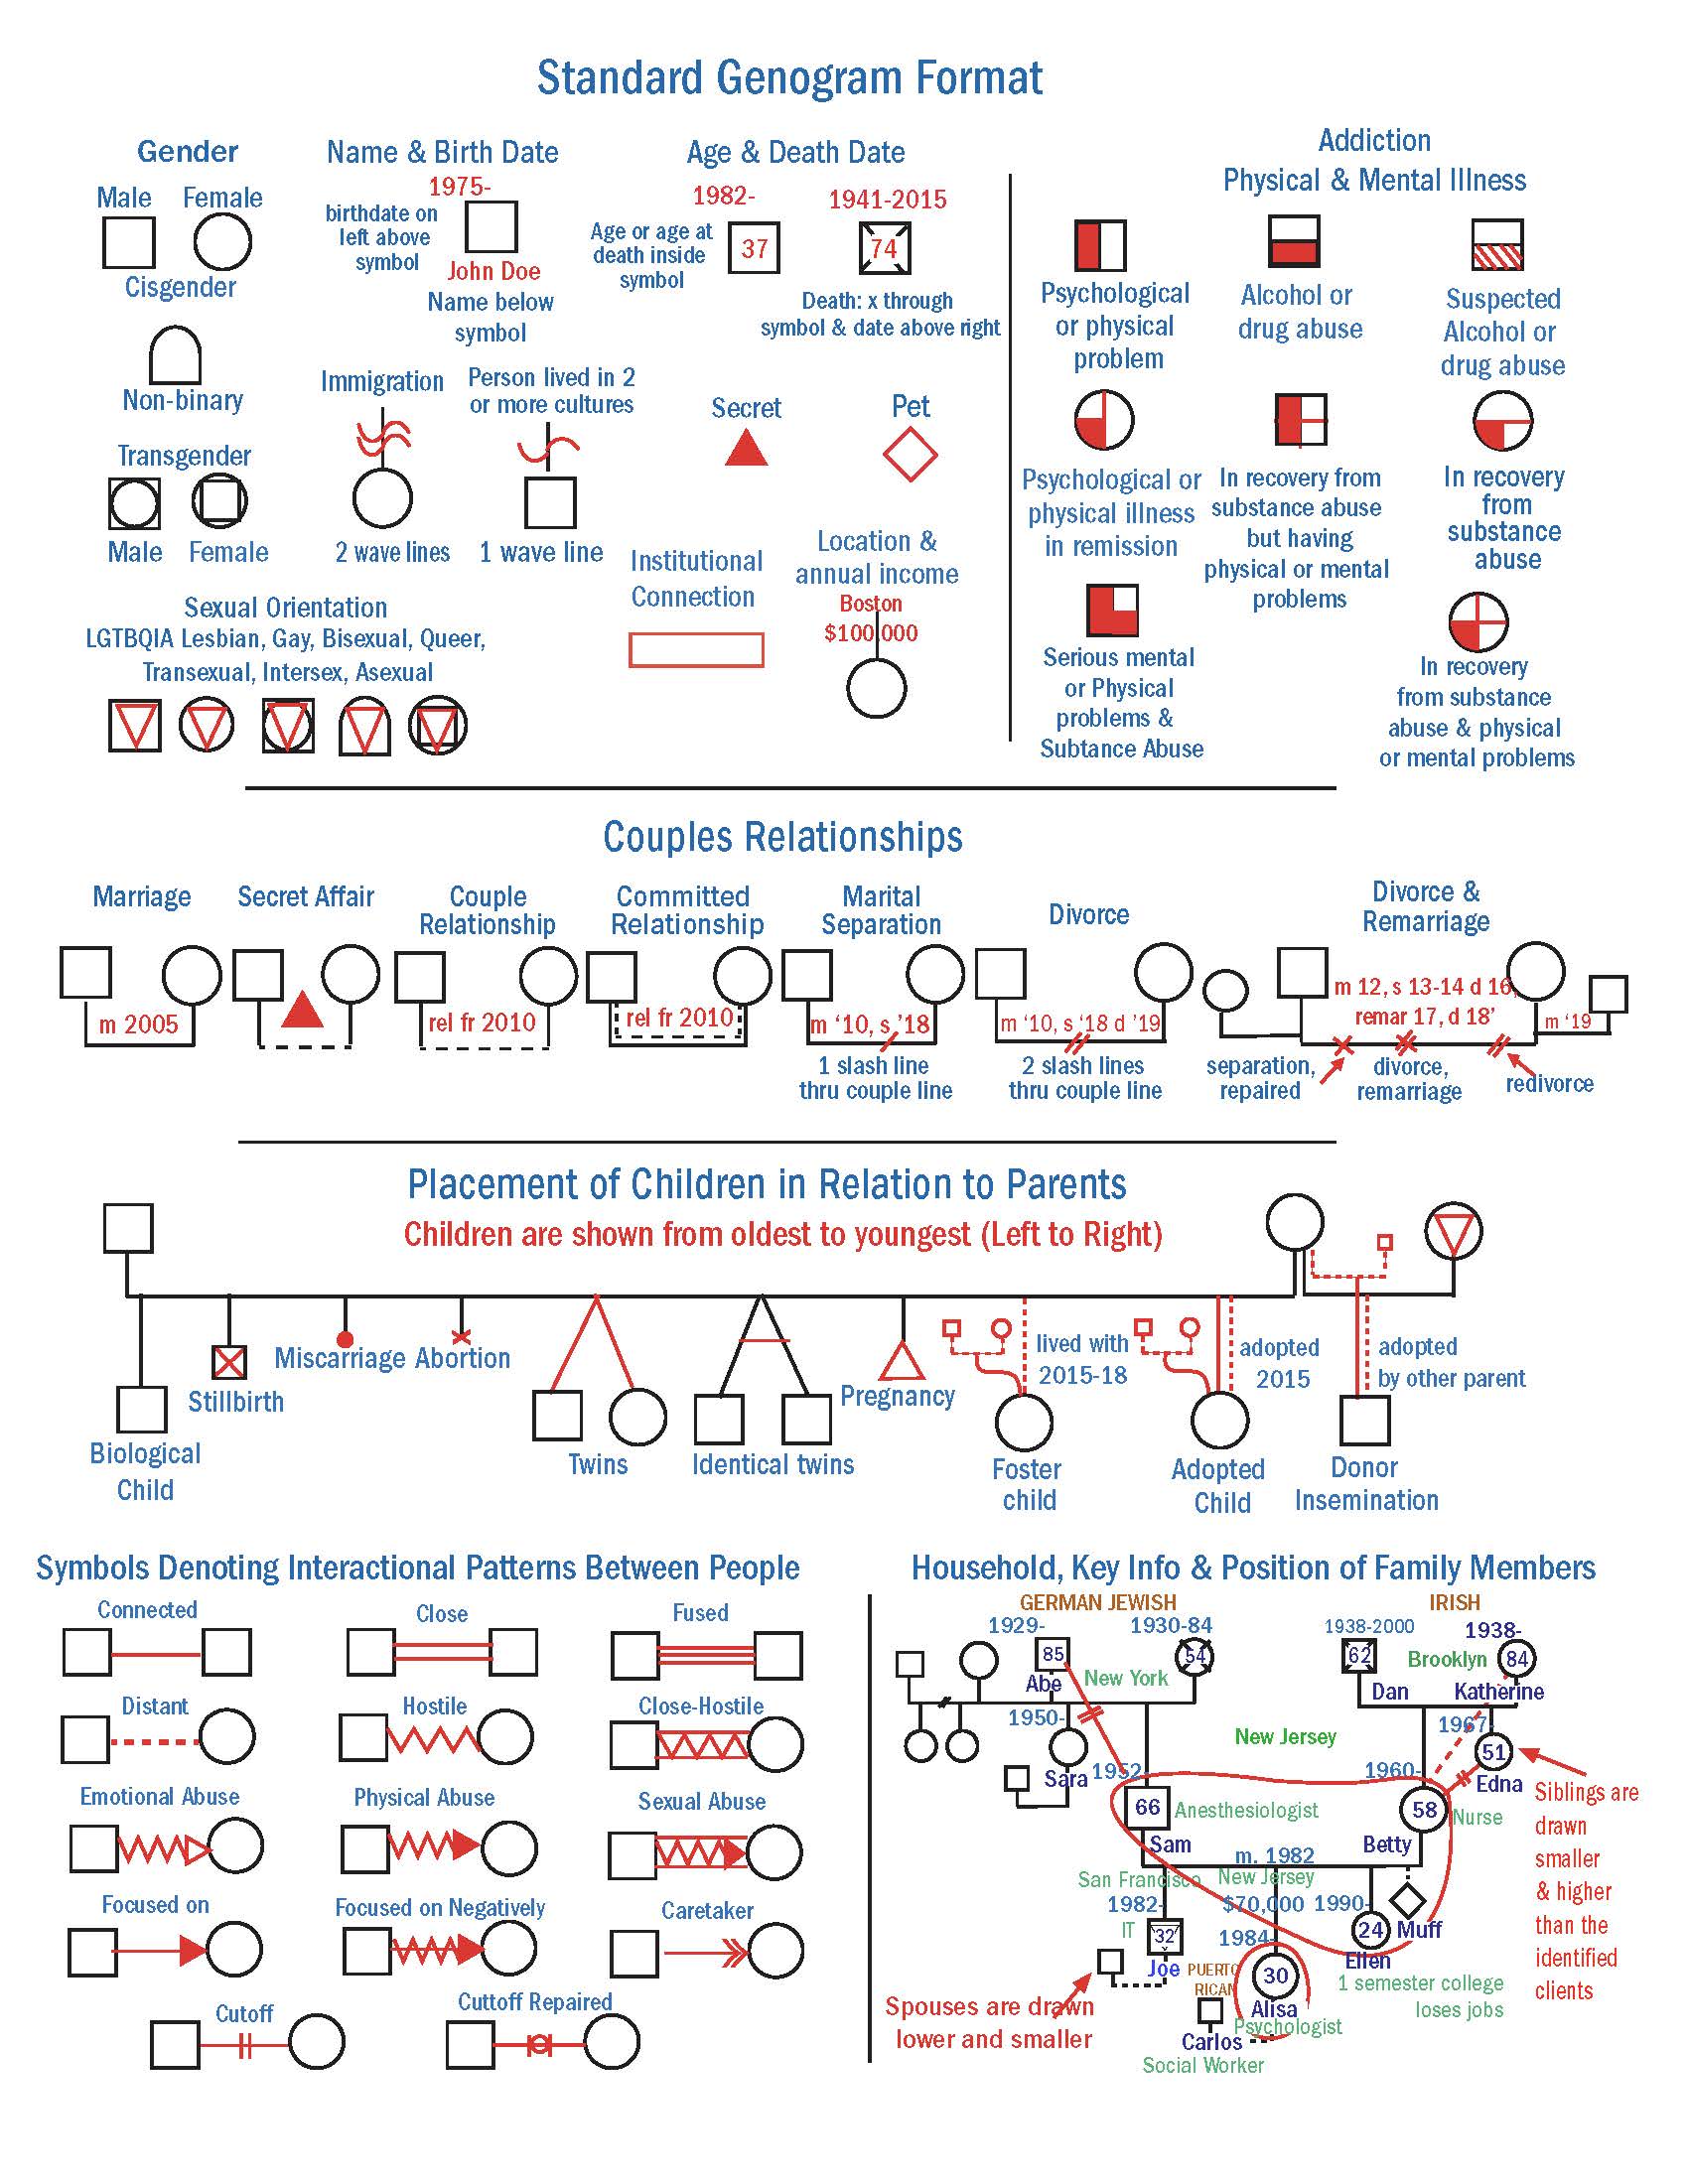
A genogram, also known as a family diagram, is a pictorial display of a person's position and ongoing relationships in their family's hereditary hierarchy. It goes beyond a traditional family tree by allowing the user to visualize social patterns and psychological factors that punctuate relationships, especially patterns that repeat over the generations. History Georgetown Family Center Therapist Murray Bowen developed the concept of the genogram. At the time, he called it a "family diagram" as part of his family systems model in the 1970s. He claimed not to know where the concept of a genogram came from but nonetheless avowed that he didn't invent it. In their 1980 book, ''The Family Life Cycle'', Betty Carter and Monica McGoldrick included genograms on the book's cover and in a page regarding the genogram format; they were copyrighted to Bowen, who had been promoting the value of genograms in family systems work. The same year, Jack Bradt, a former student of Bowen's, published ... [...More Info...] [...Related Items...] OR: [Wikipedia] [Google] [Baidu] |
Ahnentafel
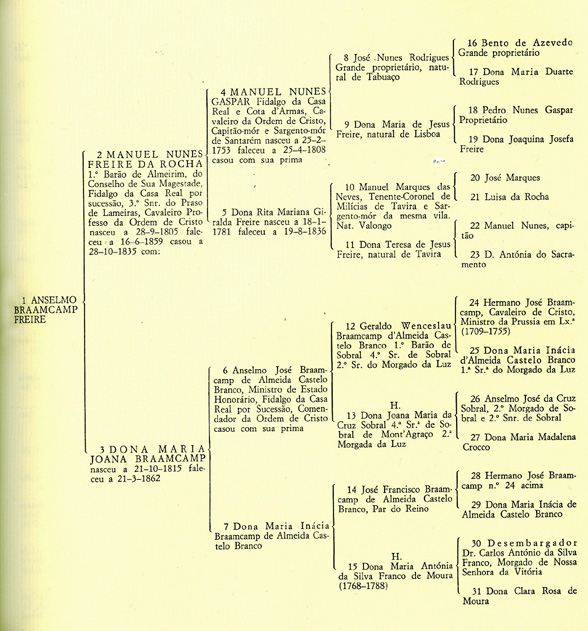
An ''ahnentafel'' ( German for "ancestor table"; ) or ''ahnenreihe'' ("ancestor series"; ) is a genealogical numbering system for listing a person's direct ancestors in a fixed sequence of ascent. The subject (or proband) of the ahnentafel is listed as , the subject's father as and the mother as , the paternal grandparents as and and the maternal grandparents as and , and so on, back through the generations. Apart from , who can be male or female, all even-numbered persons are male, and all odd-numbered persons are female. In this schema, the number of any person's father is double the person's number, and a person's mother is double the person's number plus one. Using this definition of numeration, one can derive some basic information about individuals who are listed without additional research. This construct displays a person's genealogy compactly, without the need for a diagram such as a family tree. It is particularly useful in situations where one may be restricted t ... [...More Info...] [...Related Items...] OR: [Wikipedia] [Google] [Baidu] |
Eco-map
An eco-map (or ecomap) is a graphical representation that shows all of the systems at play in an individual's life. Eco-maps are used in individual and family counseling within the social work and nursing profession. They are often a way of portraying Systems Theory in a simplistic way that both the social worker and the client can look at during the session. These ecological maps, or ecomaps, were developed by Hartman in 1975 as a means of depicting the ecological system that encompasses a family or individual. An ecogram is a combination of a genogram and an ecomap. The terms "ecogram" and "ecomap" are often used interchangeably, however.Hartman, A. (1995). Diagrammatic assessment of family relationships. Families in Society, 76, 111-122. A methodically related way to assess relationships in family therapy and research are Symbolic Figure Placement Techniques. These theranostic visualization methods (e,g., FAST, KFST) use figures on a board to represent cohesion and hierarchy in ... [...More Info...] [...Related Items...] OR: [Wikipedia] [Google] [Baidu] |
Genealogical Numbering Systems
Several genealogical numbering systems have been widely adopted for presenting family trees and pedigree charts in text format. Ascending numbering systems Ahnentafel Ahnentafel, also known as the Eytzinger Method, Sosa Method, and Sosa-Stradonitz Method, allows for the numbering of ancestors beginning with a descendant. This system allows one to derive an ancestor's number without compiling the complete list, and allows one to derive an ancestor's relationship based on their number. The number of a person's father is twice their own number, and the number of a person's mother is twice their own, plus one. For instance, if John Smith is 10, his father is 20, and his mother is 21, and his daughter is 5. In order to readily have the generation stated for a certain person, the Ahnentafel numbering may be preceded by the generation. This method's usefulness becomes apparent when applied further back in the generations: e.g. ''08-146'', is a male preceding the subject by 7 (8-1) gen ... [...More Info...] [...Related Items...] OR: [Wikipedia] [Google] [Baidu] |
Pedigree Chart
A pedigree chart is a diagram that shows the occurrence of certain traits through different generations of a family, most commonly for humans, show dogs, and race horses. Definition The word pedigree is a corruption of the Anglo-Norman French ''pé de grue'' or "crane's foot", either because the typical lines and split lines (each split leading to different offspring of the one parent line) resemble the thin leg and foot of a Crane (bird), crane or because such a mark was used to denote succession in pedigree charts. A pedigree results in the presentation of family information in the form of an easily readable chart. It can be simply called a "family tree". Pedigrees use a standardized set of symbols, squares represent males and circles represent females. Pedigree construction is a family history, and details about an earlier generation may be uncertain as memories fade. If the sex of the person is unknown, a diamond is used. Someone with the phenotype (trait) in question is repre ... [...More Info...] [...Related Items...] OR: [Wikipedia] [Google] [Baidu] |
Family Tree
A family tree, also called a genealogy or a pedigree chart, is a chart representing family relationships in a conventional tree structure. More detailed family trees, used in medicine and social work, are known as genograms. Representations of family history Genealogical data can be represented in several formats, for example, as a pedigree chart, pedigree or . Family trees are often presented with the oldest generations at the top of the tree and the younger generations at the bottom. An ancestry chart, which is a tree showing the ancestors of an individual and not all members of a family, will more closely resemble a tree in shape, being wider at the top than at the bottom. In some ancestry charts, an individual appears on the left and his or her ancestors appear to the right. Conversely, a descendant chart, which depicts all the descendants of an individual, will be narrowest at the top. Beyond these formats, some family trees might include all members of a particular surna ... [...More Info...] [...Related Items...] OR: [Wikipedia] [Google] [Baidu] |
Murray Bowen
Murray Bowen ( ; January 31, 1913, in Waverly, Tennessee – October 9, 1990) was an American psychiatrist and a professor in psychiatry at Georgetown University. Bowen was among the pioneers of family therapy and a noted founder of systemic therapy. Beginning in the 1950s he developed a systems theory of the family. Biography Murray Bowen (Lucius Murray Bowen) was born in 1913 as the oldest of five and grew up in the small town of Waverly, Tennessee, where his father was the mayor for some time. Bowen earned his Bachelor of Science degree in 1934 at the University of Tennessee in Knoxville. He received his MD in 1937 at the Medical School of the University of Tennessee in Memphis. After that, he had internships at Bellevue Hospital in New York City in 1938 and at the Grasslands Hospital, Valhalla, New York, from 1939 to 1941. From 1941 to 1946, he did his military training followed by five years of active duty with Army in the United States and Europe. During the war, whi ... [...More Info...] [...Related Items...] OR: [Wikipedia] [Google] [Baidu] |
Cousin Chart
Consanguinity (from Latin '' consanguinitas'' 'blood relationship') is the characteristic of having a kinship with a relative who is descended from a common ancestor. Many jurisdictions have laws prohibiting people who are closely related by blood from marrying or having sexual relations with each other. The degree of consanguinity that gives rise to this prohibition varies from place to place. On the other hand, around 20% of the global population lives in areas where some consanguinous marriages are preferred. The degree of relationships are also used to determine heirs of an estate according to statutes that govern intestate succession, which also vary from jurisdiction to jurisdiction. In some communities and time periods, cousin marriage is allowed or even encouraged; in others, it is taboo, and considered to be incest. The degree of relative consanguinity can be illustrated with a ''consanguinity table'' in which each level of lineal consanguinity (''generation'' or ''mei ... [...More Info...] [...Related Items...] OR: [Wikipedia] [Google] [Baidu] |
Genetic Genealogy
Genetic genealogy is the use of genealogical DNA tests, i.e., DNA profiling and DNA testing, in combination with traditional genealogical methods, to infer genetic relationships between individuals. This application of genetics came to be used by family historians in the 21st century, as DNA tests became affordable. The tests have been promoted by amateur groups, such as Surname DNA project, surname study groups or regional genealogical groups, as well as research projects such as the Genographic Project. about 30 million people had been tested. As the field developed, the aims of practitioners broadened, with many seeking knowledge of their ancestry beyond the recent centuries, for which traditional pedigrees can be constructed. History The investigation of surnames in genetics Genetics is the study of genes, genetic variation, and heredity in organisms.Hartl D, Jones E (2005) It is an important branch in biology because heredity is vital to organisms' evolution. ... [...More Info...] [...Related Items...] OR: [Wikipedia] [Google] [Baidu] |
Charts
A chart (sometimes known as a graph) is a graphical representation for data visualization, in which "the data is represented by symbols, such as bars in a bar chart, lines in a line chart, or slices in a pie chart". A chart can represent tabular numeric data, functions or some kinds of quality structure and provides different info. The term "chart" as a graphical representation of data has multiple meanings: * A data chart is a type of diagram or graph, that organizes and represents a set of numerical or qualitative data. * Maps that are adorned with extra information ( map surround) for a specific purpose are often known as charts, such as a nautical chart or aeronautical chart, typically spread over several map sheets. * Other domain-specific constructs are sometimes called charts, such as the chord chart in music notation or a record chart for album popularity. Charts are often used to ease understanding of large quantities of data and the relationships between pa ... [...More Info...] [...Related Items...] OR: [Wikipedia] [Google] [Baidu] |
Psychological Tests And Scales
Psychology is the scientific study of mind and behavior. Its subject matter includes the behavior of humans and nonhumans, both consciousness, conscious and Unconscious mind, unconscious phenomena, and mental processes such as thoughts, feelings, and motivation, motives. Psychology is an academic discipline of immense scope, crossing the boundaries between the Natural science, natural and social sciences. Biological psychologists seek an understanding of the Emergence, emergent properties of brains, linking the discipline to neuroscience. As social scientists, psychologists aim to understand the behavior of individuals and groups.Hockenbury & Hockenbury. Psychology. Worth Publishers, 2010. A professional practitioner or researcher involved in the discipline is called a psychologist. Some psychologists can also be classified as Behavioural sciences, behavioral or Cognitive science, cognitive scientists. Some psychologists attempt to understand the role of mental functions in i ... [...More Info...] [...Related Items...] OR: [Wikipedia] [Google] [Baidu] |


