|
Security Market Line
Security market line (SML) is the representation of the capital asset pricing model. It displays the expected rate of return of an individual security as a function of systematic, non-diversifiable risk. The risk of an individual risky security reflects the volatility of the return from the security rather than the return of the market portfolio. The risk in these individual risky securities reflects the systematic risk. Formula The Y-intercept of the SML is equal to the risk-free interest rate. The slope of the SML is equal to the market risk premium and reflects the risk return tradeoff at a given time: :\mathrm : E(R_i) = R_f + \beta_ (R_M) - R_f, where: : is an expected return on security : is an expected return on market portfolio :''β'' is a nondiversifiable or systematic risk : is a market rate of return : is a risk-free rate When used in portfolio management, the SML represents the investment's opportunity cost (investing in a combination of the market portfolio a ... [...More Info...] [...Related Items...] OR: [Wikipedia] [Google] [Baidu] |
Treynor Ratio
In finance, the Treynor reward-to-volatility model (sometimes called the reward-to-volatility ratio or Treynor measure), named after American economist Jack L. Treynor, is a measurement of the returns earned in excess of that which could have been earned on an investment that has no risk that can be diversified (e.g., Treasury bills or a completely diversified portfolio), per unit of market risk assumed. The Treynor ratio relates excess return over the risk-free rate to the additional risk taken; however, systematic risk is used instead of total risk. The higher the Treynor ratio, the better the performance of the portfolio under analysis. Formula :T = \frac where: :T \equiv Treynor ratio, :r_i \equiv portfolio ''is return, :r_f \equiv risk free rate :\beta_i \equiv portfolio ''is beta Example Taking the equation detailed above, let us assume that the expected portfolio return is 20%, the risk free rate is 5%, and the beta of the portfolio is 1.5. Substituting ... [...More Info...] [...Related Items...] OR: [Wikipedia] [Google] [Baidu] |
Modern Portfolio Theory
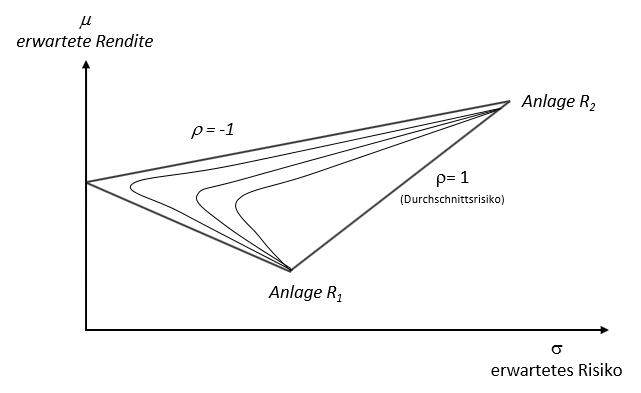
Modern portfolio theory (MPT), or mean-variance analysis, is a mathematical framework for assembling a portfolio of assets such that the expected return is maximized for a given level of risk. It is a formalization and extension of Diversification (finance), diversification in investing, the idea that owning different kinds of financial assets is less risky than owning only one type. Its key insight is that an asset's risk and return should not be assessed by itself, but by how it contributes to a portfolio's overall risk and return. The variance of return (or its transformation, the standard deviation) is used as a measure of risk, because it is tractable when assets are combined into portfolios. Often, the historical variance and covariance of returns is used as a proxy for the forward-looking versions of these quantities, but other, more sophisticated methods are available. Economist Harry Markowitz introduced MPT in a 1952 paper, for which he was later awarded a Nobel Memorial ... [...More Info...] [...Related Items...] OR: [Wikipedia] [Google] [Baidu] |
Market Portfolio
Market portfolio is an investment portfolio that theoretically consisting of a weighted sum of every asset in the market, with weights in the proportions that they exist in the market, with the necessary assumption that these assets are infinitely divisible. The concept is related to asset allocation and has been critiqued by some economists. In practice index providers and exchange-traded funds (ETF) providers create proxies of a market portfolio using securities that are available on securities exchanges in proportion of their weighting. Critiques Richard Roll's critique states that this is only a theoretical concept, as to create a market portfolio for investment purposes in practice would necessarily include every single possible available asset, including real estate, precious metals, stamp collections, jewelry, and anything with any worth, as the theoretical market being referred to would be the world market. There is some question of whether what is used for the mar ... [...More Info...] [...Related Items...] OR: [Wikipedia] [Google] [Baidu] |
Efficient Frontier
In modern portfolio theory, the efficient frontier (or portfolio frontier) is an investment portfolio which occupies the "efficient" parts of the risk–return spectrum. Formally, it is the set of portfolios which satisfy the condition that no other portfolio exists with a higher expected return but with the same standard deviation of return (i.e., the risk). The efficient frontier was first formulated by Harry Markowitz in 1952; see Markowitz model. Overview A combination of assets, i.e. a portfolio, is referred to as "efficient" if it has the best possible expected level of return for its level of risk (which is represented by the standard deviation of the portfolio's return). Here, every possible combination of risky assets can be plotted in risk–expected return space, and the collection of all such possible portfolios defines a region in this space. In the absence of the opportunity to hold a risk-free asset, this region is the opportunity set (the feasible set) ... [...More Info...] [...Related Items...] OR: [Wikipedia] [Google] [Baidu] |
Capital Allocation Line
Capital allocation line (CAL) is a graph created by investors to measure the risk of risky and risk-free assets. The graph displays the return to be made by taking on a certain level of risk. Its slope is known as the "reward-to-variability ratio". Formula The capital allocation line is a straight line that has the following equation: :\mathrm : E(r_) = r_F + \sigma_C \frac In this formula ''P'' is the risky portfolio, ''F'' is riskless portfolio, and ''C'' is a combination of portfolios ''P'' and ''F''. The slope of the capital allocation line is equal to the incremental return of the portfolio to the incremental increase of risk. Hence, the slope of the capital allocation line is called the reward-to-variability ratio because the expected return increases continually with the increase of risk as measured by the standard deviation. Derivation If investors can purchase a risk free asset with some return ''rF'', then all correctly priced risky assets or portfolios will have ex ... [...More Info...] [...Related Items...] OR: [Wikipedia] [Google] [Baidu] |
Alpha (investment)
Alpha is a measure of the active return on an investment, the performance of that investment compared with a suitable stock market index, market index. An alpha of 1% means the investment's return on investment over a selected period of time was 1% better than the market during that same period; a negative alpha means the investment underperformed the market. Alpha, along with Beta (finance), beta, is one of two key coefficients in the capital asset pricing model used in modern portfolio theory and is closely related to other important quantities such as Standard deviation#Finance, standard deviation, R-squared and the Sharpe ratio#Use in finance, Sharpe ratio. In modern financial markets, where index funds are widely available for purchase, alpha is commonly used to judge the performance of mutual funds and similar investments. As these funds include various fees normally expressed in percent terms, the fund has to maintain an alpha greater than its fees in order to provide posi ... [...More Info...] [...Related Items...] OR: [Wikipedia] [Google] [Baidu] |
Systematic Risk
In finance and economics, systematic risk (in economics often called aggregate risk or undiversifiable risk) is vulnerability to events which affect aggregate outcomes such as broad market returns, total economy-wide resource holdings, or aggregate income. In many contexts, events like earthquakes, epidemics and major weather catastrophes pose aggregate risks that affect not only the distribution but also the total amount of resources. That is why it is also known as contingent risk, unplanned risk or risk events. If every possible outcome of a stochastic economic process is characterized by the same aggregate result (but potentially different distributional outcomes), the process then has no aggregate risk. Properties Systematic or aggregate risk arises from market structure or dynamics which produce shocks or uncertainty faced by all agents in the market; such shocks could arise from government policy, international economic forces, or acts of nature. In contrast, specific ris ... [...More Info...] [...Related Items...] OR: [Wikipedia] [Google] [Baidu] |
Efficient Market Hypothesis
The efficient-market hypothesis (EMH) is a hypothesis in financial economics that states that asset prices reflect all available information. A direct implication is that it is impossible to "beat the market" consistently on a risk-adjusted basis since market prices should only react to new information. Because the EMH is formulated in terms of risk adjustment, it only makes testable predictions when coupled with a particular model of risk. As a result, research in financial economics since at least the 1990s has focused on market anomalies, that is, deviations from specific models of risk. The idea that financial market returns are difficult to predict goes back to Bachelier, Mandelbrot, and Samuelson, but is closely associated with Eugene Fama, in part due to his influential 1970 review of the theoretical and empirical research. The EMH provides the basic logic for modern risk-based theories of asset prices, and frameworks such as consumption-based asset pricing and int ... [...More Info...] [...Related Items...] OR: [Wikipedia] [Google] [Baidu] |
Stock Picking
Stock valuation is the method of calculating theoretical values of companies and their stocks. The main use of these methods is to predict future market prices, or more generally, potential market prices, and thus to profit from price movement – stocks that are judged '' undervalued'' (with respect to their theoretical value) are bought, while stocks that are judged ''overvalued'' are sold, in the expectation that undervalued stocks will overall rise in value, while overvalued stocks will generally decrease in value. A target price is a price at which an analyst believes a stock to be fairly valued relative to its projected and historical earnings. In the view of fundamental analysis, stock valuation based on fundamentals aims to give an estimate of the intrinsic value of a stock, based on predictions of the future cash flows and profitability of the business. Fundamental analysis may be replaced or augmented by market criteria – what the market will pay for the stock, disr ... [...More Info...] [...Related Items...] OR: [Wikipedia] [Google] [Baidu] |
Tom Geurts
Tom Geerd Geurts (born in Dedemsvaart on April 2, 1964) is a Dutch economist currently employed by Bucknell University and an Honorary Professor at the Technische Universität Berlin. Current Chair of the Education Committee of the American Real Estate Society (ARES), and previously Director of Academic Affairs of the Schack institute of New York University. He wrote numerous presentations and publications in the field of Real Estate and Finance, for example in the field of Security Market Line.Tom Geurts and Andrey Pavlov, "Calculating the Cost of Capital for REITs: A Classroom Explanation." Real Estate Review 34 (Fall 2006). He is the son of Joop Geurts. References External links Tom G. Geurtsat the George Washington University The George Washington University (GW or GWU) is a Private university, private University charter#Federal, federally-chartered research university in Washington, D.C., United States. Originally named Columbian College, it was chartered in 1821 by ... ... [...More Info...] [...Related Items...] OR: [Wikipedia] [Google] [Baidu] |


