|
Reassignment Method
The method of reassignment is a technique for sharpening a time-frequency representation by mapping the data to time-frequency coordinates that are nearer to the true region of support of the analyzed signal. The method has been independently introduced by several parties under various names, including ''method of reassignment'', ''remapping'', ''time-frequency reassignment'', and ''modified moving-window method''. In the case of the spectrogram or the short-time Fourier transform, the method of reassignment sharpens blurry time-frequency data by relocating the data according to local estimates of instantaneous frequency and group delay. This mapping to reassigned time-frequency coordinates is very precise for signals that are separable in time and frequency with respect to the analysis window. Introduction Many signals of interest have a distribution of energy that varies in time and frequency. For example, any sound signal having a beginning or an end has an energy distri ... [...More Info...] [...Related Items...] OR: [Wikipedia] [Google] [Baidu] |
Support (mathematics)
In mathematics, the support of a real-valued function f is the subset of the function domain containing the elements which are not mapped to zero. If the domain of f is a topological space, then the support of f is instead defined as the smallest closed set containing all points not mapped to zero. This concept is used very widely in mathematical analysis. Formulation Suppose that f : X \to \R is a real-valued function whose domain is an arbitrary set X. The of f, written \operatorname(f), is the set of points in X where f is non-zero: \operatorname(f) = \. The support of f is the smallest subset of X with the property that f is zero on the subset's complement. If f(x) = 0 for all but a finite number of points x \in X, then f is said to have . If the set X has an additional structure (for example, a topology), then the support of f is defined in an analogous way as the smallest subset of X of an appropriate type such that f vanishes in an appropriate sense on its compleme ... [...More Info...] [...Related Items...] OR: [Wikipedia] [Google] [Baidu] |
Spectrogram
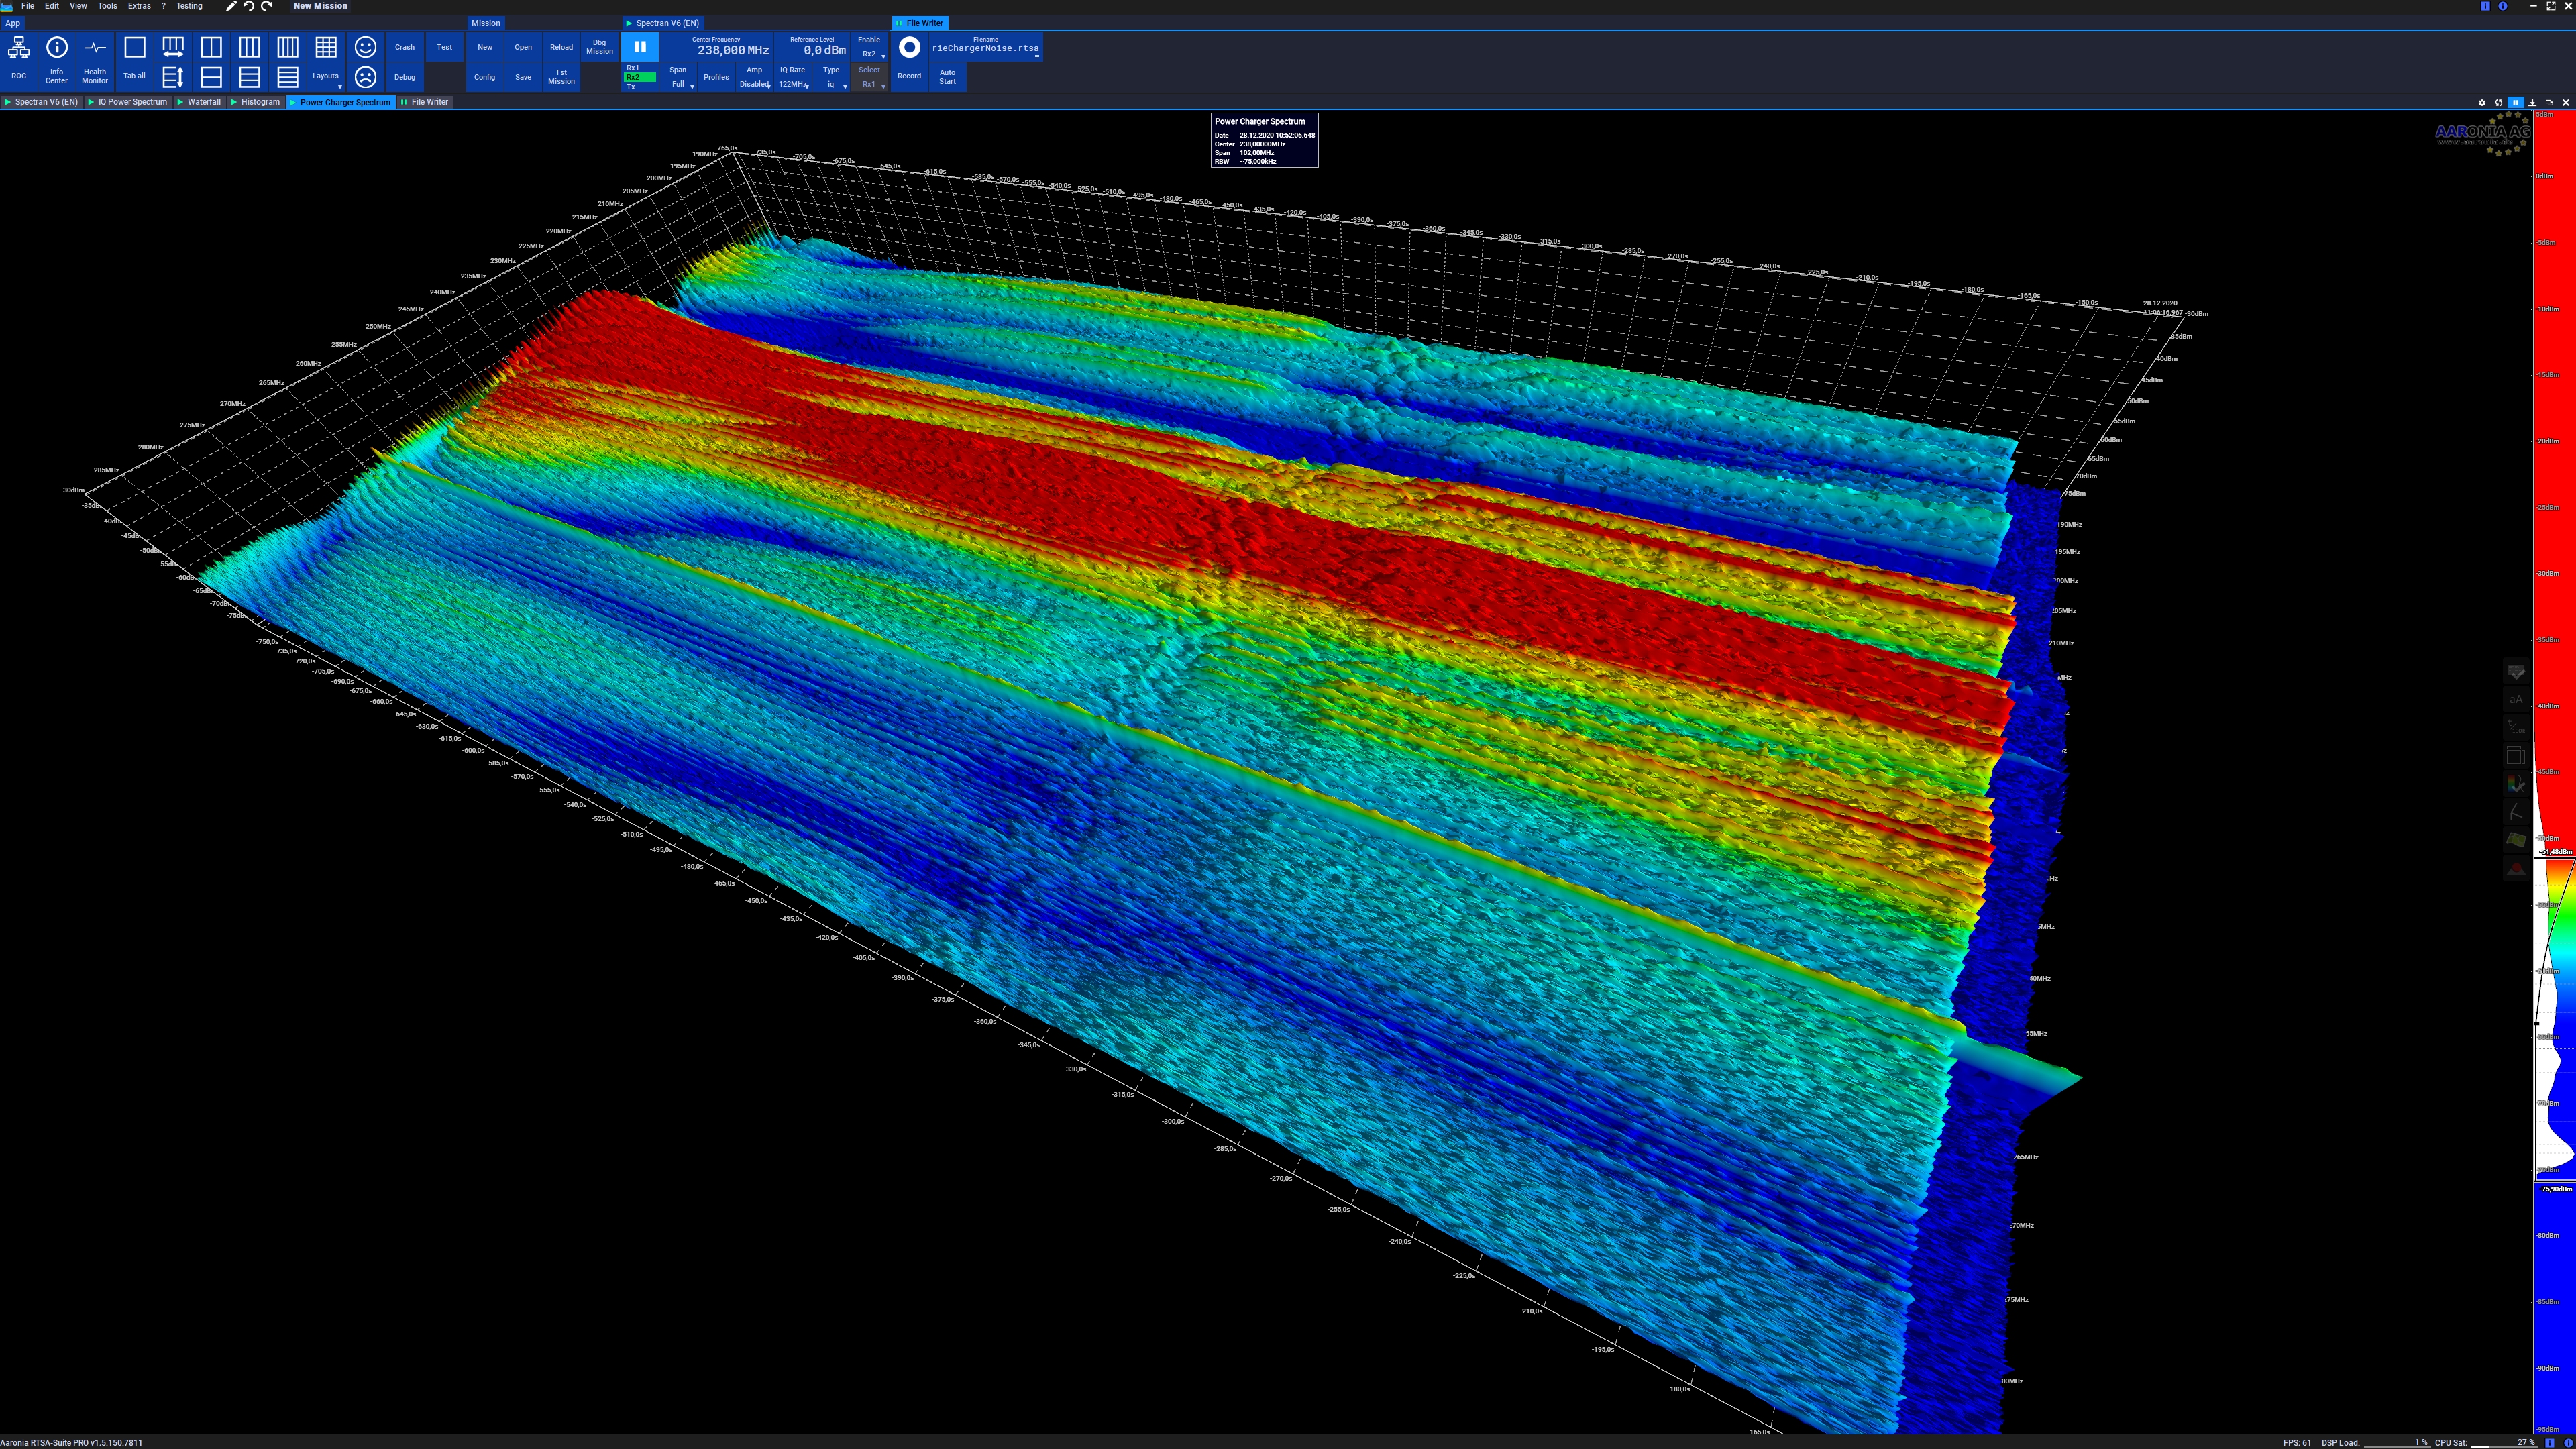
A spectrogram is a visual representation of the spectrum of frequencies of a signal as it varies with time. When applied to an audio signal, spectrograms are sometimes called sonographs, voiceprints, or voicegrams. When the data are represented in a 3D plot they may be called '' waterfall displays''. Spectrograms are used extensively in the fields of music, linguistics, sonar, radar, speech processing, seismology, and others. Spectrograms of audio can be used to identify spoken words phonetically, and to analyse the various calls of animals. A spectrogram can be generated by an optical spectrometer, a bank of band-pass filters, by Fourier transform or by a wavelet transform (in which case it is also known as a scaleogram or scalogram). A spectrogram is usually depicted as a heat map, i.e., as an image with the intensity shown by varying the colour or brightness. Format A common format is a graph with two geometric dimensions: one axis represents time, and the other a ... [...More Info...] [...Related Items...] OR: [Wikipedia] [Google] [Baidu] |
Short-time Fourier Transform
The short-time Fourier transform (STFT), is a Fourier-related transform used to determine the sinusoidal frequency and phase content of local sections of a signal as it changes over time. In practice, the procedure for computing STFTs is to divide a longer time signal into shorter segments of equal length and then compute the Fourier transform separately on each shorter segment. This reveals the Fourier spectrum on each shorter segment. One then usually plots the changing spectra as a function of time, known as a spectrogram or waterfall plot, such as commonly used in software defined radio (SDR) based spectrum displays. Full bandwidth displays covering the whole range of an SDR commonly use fast Fourier transforms (FFTs) with 2^24 points on desktop computers. Forward STFT Continuous-time STFT Simply, in the continuous-time case, the function to be transformed is multiplied by a window function which is nonzero for only a short period of time. The Fourier transform (a ... [...More Info...] [...Related Items...] OR: [Wikipedia] [Google] [Baidu] |
Wigner–Ville Distribution
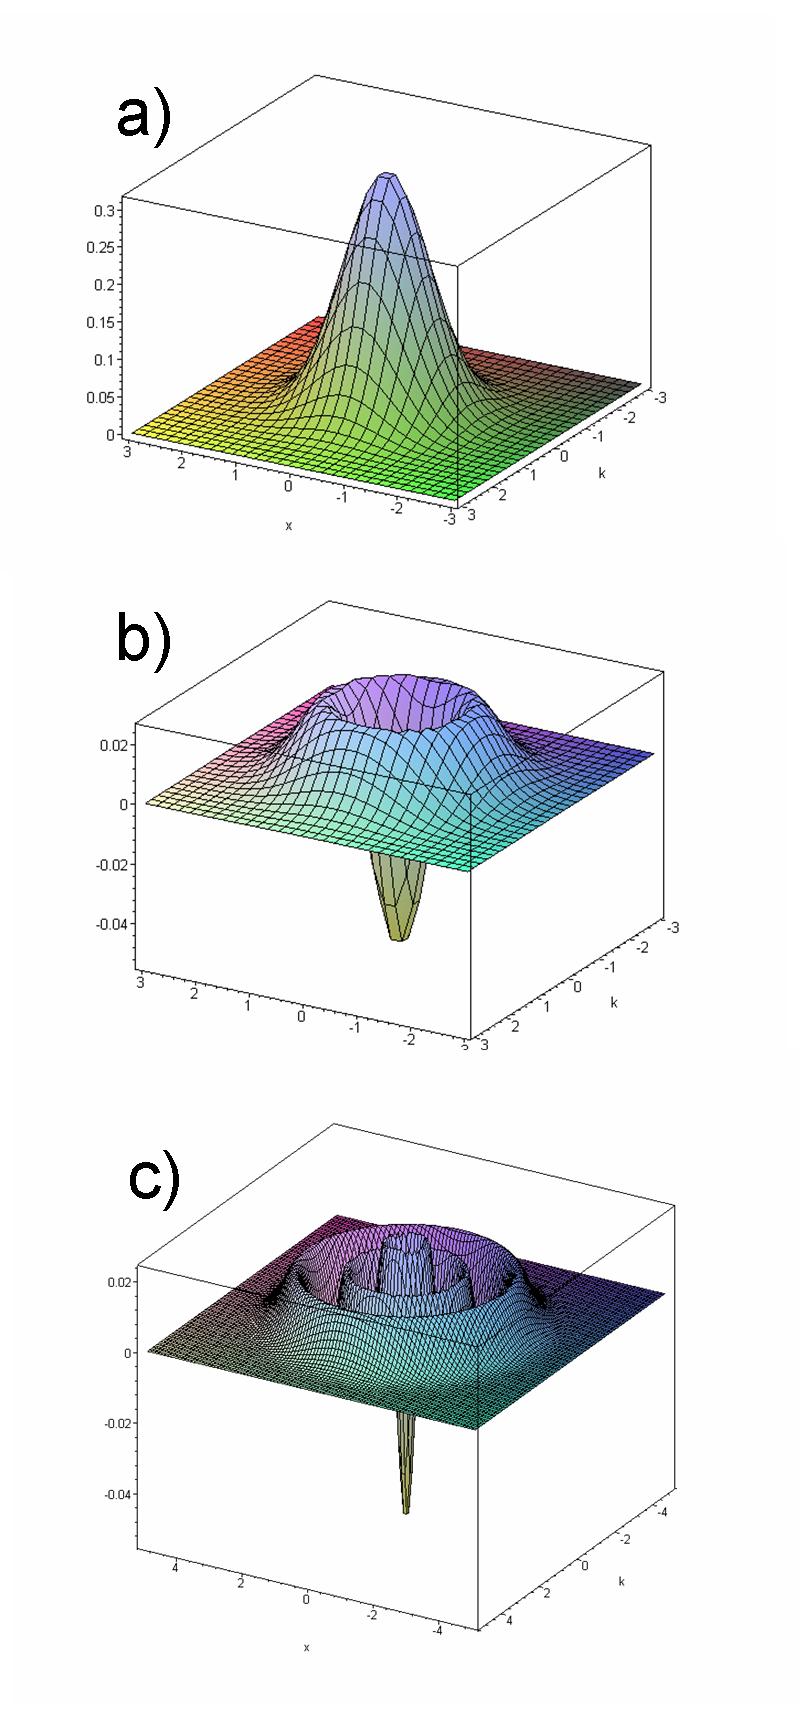
The Wigner quasiprobability distribution (also called the Wigner function or the Wigner–Ville distribution, after Eugene Wigner and Jean-André Ville) is a quasiprobability distribution. It was introduced by Eugene Wigner in 1932 to study quantum corrections to classical statistical mechanics. The goal was to link the wavefunction that appears in Schrödinger's equation to a probability distribution in phase space. It is a generating function for all spatial autocorrelation functions of a given quantum-mechanical wavefunction . Thus, it maps on the quantum density matrix in the map between real phase-space functions and Hermitian operators introduced by Hermann Weyl in 1927, in a context related to representation theory in mathematics (see Weyl quantization). In effect, it is the Wigner–Weyl transform of the density matrix, so the realization of that operator in phase space. It was later rederived by Jean Ville in 1948 as a quadratic (in signal) representation of the lo ... [...More Info...] [...Related Items...] OR: [Wikipedia] [Google] [Baidu] |
Stationary Phase Approximation
In mathematics, the stationary phase approximation is a basic principle of asymptotic analysis, applying to the limit as k \to \infty . This method originates from the 19th century, and is due to George Gabriel Stokes and Lord Kelvin. It is closely related to Laplace's method and the method of steepest descent, but Laplace's contribution precedes the others. Basics The main idea of stationary phase methods relies on the cancellation of sinusoids with rapidly varying phase. If many sinusoids have the same phase and they are added together, they will add constructively. If, however, these same sinusoids have phases which change rapidly as the frequency changes, they will add incoherently, varying between constructive and destructive addition at different times. Formula Letting \Sigma denote the set of critical points of the function f (i.e. points where \nabla f =0), under the assumption that g is either compactly supported or has exponential decay, and that all critical po ... [...More Info...] [...Related Items...] OR: [Wikipedia] [Google] [Baidu] |
Time–frequency Analysis
In signal processing, time–frequency analysis comprises those techniques that study a signal in both the time and frequency domains ''simultaneously,'' using various time–frequency representations. Rather than viewing a 1-dimensional signal (a function, real or complex-valued, whose domain is the real line) and some transform (another function whose domain is the real line, obtained from the original via some transform), time–frequency analysis studies a two-dimensional signal – a function whose domain is the two-dimensional real plane, obtained from the signal via a time–frequency transform. The mathematical motivation for this study is that functions and their transform representation are tightly connected, and they can be understood better by studying them jointly, as a two-dimensional object, rather than separately. A simple example is that the 4-fold periodicity of the Fourier transform – and the fact that two-fold Fourier transform reverses direction – can be in ... [...More Info...] [...Related Items...] OR: [Wikipedia] [Google] [Baidu] |


