|
Pole Figure
A pole figure is a graphical representation of the orientation of objects in space. For example, pole figures in the form of stereographic projections are used to represent the orientation distribution of crystallographic lattice plane (mathematics), planes in crystallography and Texture (crystalline), texture analysis in materials science. Definition Consider an object with a basis (linear algebra), basis attached to it. The orientation of the object in space can be determined by three rotations to transform the reference basis of space to the basis attached to the object; these are the Euler angles. If we consider a plane (mathematics), plane of the object, the orientation of the plane can be given by its normal line (mathematics), line. If we draw a sphere with the center on the plane, then * the intersection (set theory), intersection of the sphere and the plane is a circle, called the "trace" ; * the intersection of the normal line and the sphere is the pole. A single pole ... [...More Info...] [...Related Items...] OR: [Wikipedia] [Google] [Baidu] |
Stereographic Projection
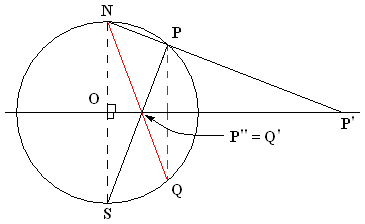
In mathematics, a stereographic projection is a perspective projection of the sphere, through a specific point on the sphere (the ''pole'' or ''center of projection''), onto a plane (geometry), plane (the ''projection plane'') perpendicular to the diameter through the point. It is a smooth function, smooth, bijection, bijective function (mathematics), function from the entire sphere except the center of projection to the entire plane. It maps circle of a sphere, circles on the sphere to generalised circle, circles or lines on the plane, and is conformal map, conformal, meaning that it preserves angles at which curves meet and thus Local property, locally approximately preserves similarity (geometry), shapes. It is neither isometry, isometric (distance preserving) nor Equiareal map, equiareal (area preserving). The stereographic projection gives a way to representation (mathematics), represent a sphere by a plane. The metric tensor, metric induced metric, induced by the inverse s ... [...More Info...] [...Related Items...] OR: [Wikipedia] [Google] [Baidu] |
Bragg's Law
In physics and chemistry , Bragg's law, Wulff–Bragg's condition or Laue–Bragg interference, a special case of Laue diffraction, gives the angles for coherent scattering of waves from a crystal lattice. It encompasses the superposition of wave fronts scattered by lattice planes, leading to a strict relation between wavelength and scattering angle, or else to the wavevector transfer with respect to the crystal lattice. Such law had initially been formulated for X-rays upon crystals. However, It applies to all sorts of quantum beams, including neutron and electron waves at atomic distances, as well as visible light at artificial periodic microscale lattices. History Bragg diffraction (also referred to as the Bragg formulation of X-ray diffraction) was first proposed by Lawrence Bragg and his father, William Henry Bragg, in 1913 in response to their discovery that crystalline solids produced surprising patterns of reflected X-rays (in contrast to that of, say, a liquid). They ... [...More Info...] [...Related Items...] OR: [Wikipedia] [Google] [Baidu] |
Transmission Electron Microscope
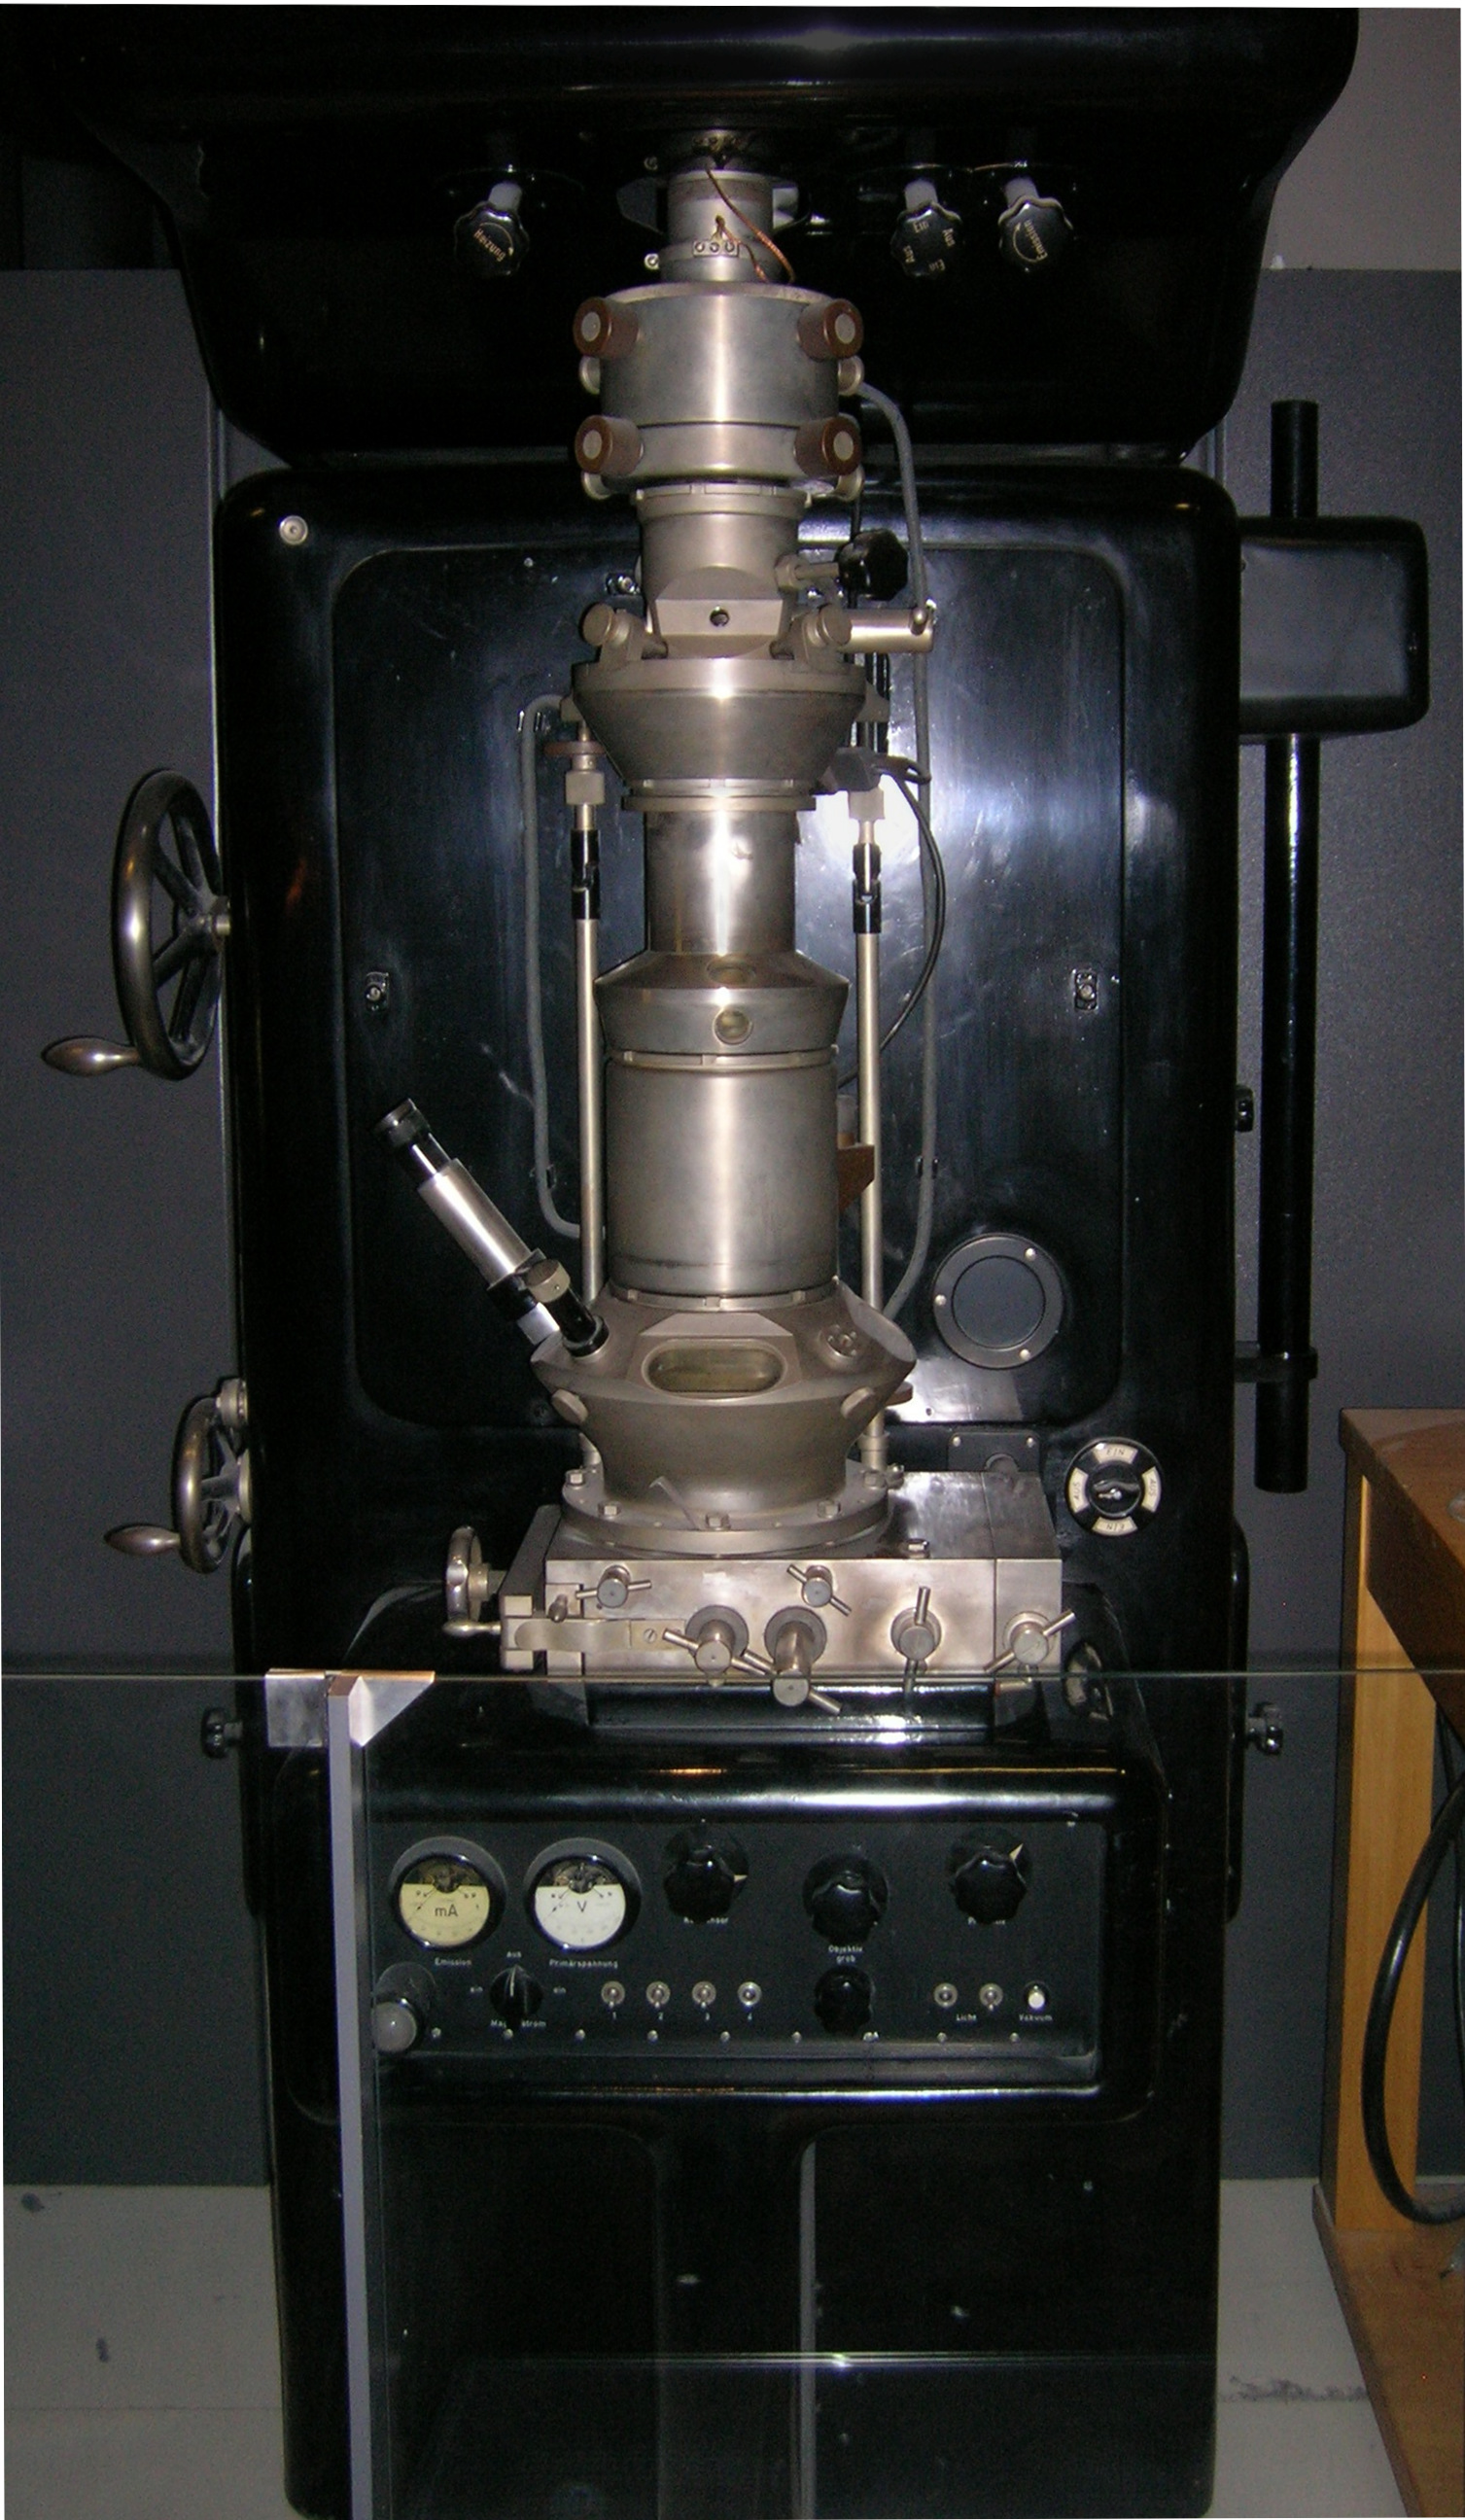
Transmission electron microscopy (TEM) is a microscopy technique in which a beam of electrons is transmitted through a specimen to form an image. The specimen is most often an ultrathin section less than 100 nm thick or a suspension on a grid. An image is formed from the interaction of the electrons with the sample as the beam is transmitted through the specimen. The image is then magnified and focused onto an imaging device, such as a fluorescent screen, a layer of photographic film, or a sensor such as a scintillator attached to a charge-coupled device. Transmission electron microscopes are capable of imaging at a significantly higher resolution than light microscopes, owing to the smaller de Broglie wavelength of electrons. This enables the instrument to capture fine detail—even as small as a single column of atoms, which is thousands of times smaller than a resolvable object seen in a light microscope. Transmission electron microscopy is a major analytical method in ... [...More Info...] [...Related Items...] OR: [Wikipedia] [Google] [Baidu] |
Laue Method
X-ray crystallography is the experimental science determining the atomic and molecular structure of a crystal, in which the crystalline structure causes a beam of incident X-rays to diffract into many specific directions. By measuring the angles and intensities of these diffracted beams, a crystallographer can produce a three-dimensional picture of the density of electrons within the crystal. From this electron density, the mean positions of the atoms in the crystal can be determined, as well as their chemical bonds, their crystallographic disorder, and various other information. Since many materials can form crystals—such as salts, metals, minerals, semiconductors, as well as various inorganic, organic, and biological molecules—X-ray crystallography has been fundamental in the development of many scientific fields. In its first decades of use, this method determined the size of atoms, the lengths and types of chemical bonds, and the atomic-scale differences among various mat ... [...More Info...] [...Related Items...] OR: [Wikipedia] [Google] [Baidu] |
X-ray Diffraction
X-ray crystallography is the experimental science determining the atomic and molecular structure of a crystal, in which the crystalline structure causes a beam of incident X-rays to diffract into many specific directions. By measuring the angles and intensities of these diffracted beams, a crystallographer can produce a three-dimensional picture of the density of electrons within the crystal. From this electron density, the mean positions of the atoms in the crystal can be determined, as well as their chemical bonds, their crystallographic disorder, and various other information. Since many materials can form crystals—such as salts, metals, minerals, semiconductors, as well as various inorganic, organic, and biological molecules—X-ray crystallography has been fundamental in the development of many scientific fields. In its first decades of use, this method determined the size of atoms, the lengths and types of chemical bonds, and the atomic-scale differences among various mat ... [...More Info...] [...Related Items...] OR: [Wikipedia] [Google] [Baidu] |
Figure De Pôle Et Figure De Diffraction
Figure may refer to: General *A shape, drawing, depiction, or geometric configuration *Figure (wood), wood appearance *Figure (music), distinguished from musical motif *Noise figure, in telecommunication *Dance figure, an elementary dance pattern *A person's figure, human physical appearance Arts *Figurine, a miniature statuette representation of a creature *Action figure, a posable jointed solid plastic character figurine *Figure painting, realistic representation, especially of the human form *Figure drawing *Model figure, a scale model of a creature Writing *figure, in writing, a type of floating block (text, table, or graphic separate from the main text) *Figure of speech, also called a rhetorical figure *Christ figure, a type of character * in typesetting, text figures and lining figures Accounting *Figure, a synonym for number *Significant figures in a decimal number Science *Figure of the Earth, the size and shape of the Earth in geodesy Sports *Figure (horse), a sta ... [...More Info...] [...Related Items...] OR: [Wikipedia] [Google] [Baidu] |
Contour Plot
A contour line (also isoline, isopleth, or isarithm) of a function of two variables is a curve along which the function has a constant value, so that the curve joins points of equal value. It is a plane section of the three-dimensional graph of the function f(x,y) parallel to the (x,y)-plane. More generally, a contour line for a function of two variables is a curve connecting points where the function has the same particular value. In cartography, a contour line (often just called a "contour") joins points of equal elevation (height) above a given level, such as mean sea level. A contour map is a map illustrated with contour lines, for example a topographic map, which thus shows valleys and hills, and the steepness or gentleness of slopes. The contour interval of a contour map is the difference in elevation between successive contour lines. The gradient of the function is always perpendicular to the contour lines. When the lines are close together the magnitude of the gradie ... [...More Info...] [...Related Items...] OR: [Wikipedia] [Google] [Baidu] |
Miller Indices
Miller indices form a notation system in crystallography for lattice planes in crystal (Bravais) lattices. In particular, a family of lattice planes of a given (direct) Bravais lattice is determined by three integers ''h'', ''k'', and ''ℓ'', the ''Miller indices''. They are written (hkℓ), and denote the family of (parallel) lattice planes (of the given Bravais lattice) orthogonal to \mathbf_ = h\mathbf + k\mathbf + \ell\mathbf, where \mathbf are the basis or primitive translation vectors of the reciprocal lattice for the given Bravais lattice. (Note that the plane is not always orthogonal to the linear combination of direct or original lattice vectors h\mathbf + k\mathbf + \ell\mathbf because the direct lattice vectors need not be mutually orthogonal.) This is based on the fact that a reciprocal lattice vector \mathbf (the vector indicating a reciprocal lattice point from the reciprocal lattice origin) is the wavevector of a plane wave in the Fourier series of a spatia ... [...More Info...] [...Related Items...] OR: [Wikipedia] [Google] [Baidu] |
Wulff Net
In mathematics, a stereographic projection is a perspective projection of the sphere, through a specific point on the sphere (the ''pole'' or ''center of projection''), onto a plane (the ''projection plane'') perpendicular to the diameter through the point. It is a smooth, bijective function from the entire sphere except the center of projection to the entire plane. It maps circles on the sphere to circles or lines on the plane, and is conformal, meaning that it preserves angles at which curves meet and thus locally approximately preserves shapes. It is neither isometric (distance preserving) nor equiareal (area preserving). The stereographic projection gives a way to represent a sphere by a plane. The metric induced by the inverse stereographic projection from the plane to the sphere defines a geodesic distance between points in the plane equal to the spherical distance between the spherical points they represent. A two-dimensional coordinate system on the stereographi ... [...More Info...] [...Related Items...] OR: [Wikipedia] [Google] [Baidu] |


