|
NGC 5548
NGC 5548 is a Type I Seyfert galaxy with a bright, active nucleus. This activity is caused by matter flowing onto a 65 million solar mass () supermassive black hole at the core. Morphologically, this is an unbarred lenticular galaxy with tightly-wound spiral arms, while shell and tidal tail features suggest that it has undergone a cosmologically-recent merger or interaction event. NGC 5548 is approximately 245 million light years away and appears in the constellation Boötes. The apparent visual magnitude of NGC 5548 is approximately 13.3 in the V band. In 1943, this galaxy was one of twelve nebulae listed by American astronomer Carl Keenan Seyfert that showed broad emission lines in their nuclei. Members of this class of objects became known as Seyfert galaxies, and they were noted to have a higher than normal surface brightness in their nuclei. Observation of NGC 5548 during the 1960s with radio telescopes showed an enhanced level of radio emission. Spectrograms of the nucleus ... [...More Info...] [...Related Items...] OR: [Wikipedia] [Google] [Baidu] |
New General Catalogue
The ''New General Catalogue of Nebulae and Clusters of Stars'' (abbreviated NGC) is an astronomical catalogue of deep-sky objects compiled by John Louis Emil Dreyer in 1888. The NGC contains 7,840 objects, including galaxies, star clusters and emission nebulae. Dreyer published two supplements to the NGC in 1895 and 1908, known as the ''Index Catalogues'' (abbreviated IC), describing a further 5,386 astronomical objects. Thousands of these objects are best known by their NGC or IC numbers, which remain in widespread use. The NGC expanded and consolidated the cataloguing work of William and Caroline Herschel, and John Herschel's ''General Catalogue of Nebulae and Clusters of Stars''. Objects south of the celestial equator are catalogued somewhat less thoroughly, but many were included based on observation by John Herschel or James Dunlop. The NGC contained multiple errors, but attempts to eliminate them were made by the ''Revised New General Catalogue'' (RNGC) by Jack W. Sulent ... [...More Info...] [...Related Items...] OR: [Wikipedia] [Google] [Baidu] |
Apparent Visual Magnitude
Apparent magnitude () is a measure of the brightness of a star or other astronomical object observed from Earth. An object's apparent magnitude depends on its intrinsic luminosity, its distance from Earth, and any extinction of the object's light caused by interstellar dust along the line of sight to the observer. The word ''magnitude'' in astronomy, unless stated otherwise, usually refers to a celestial object's apparent magnitude. The magnitude scale dates back to the ancient Roman astronomer Claudius Ptolemy, whose star catalog listed stars from 1st magnitude (brightest) to 6th magnitude (dimmest). The modern scale was mathematically defined in a way to closely match this historical system. The scale is reverse logarithmic: the brighter an object is, the lower its magnitude number. A difference of 1.0 in magnitude corresponds to a brightness ratio of \sqrt /math>, or about 2.512. For example, a star of magnitude 2.0 is 2.512 times as bright as a star of magnitude 3.0, 6.3 ... [...More Info...] [...Related Items...] OR: [Wikipedia] [Google] [Baidu] |
Stellar Corona
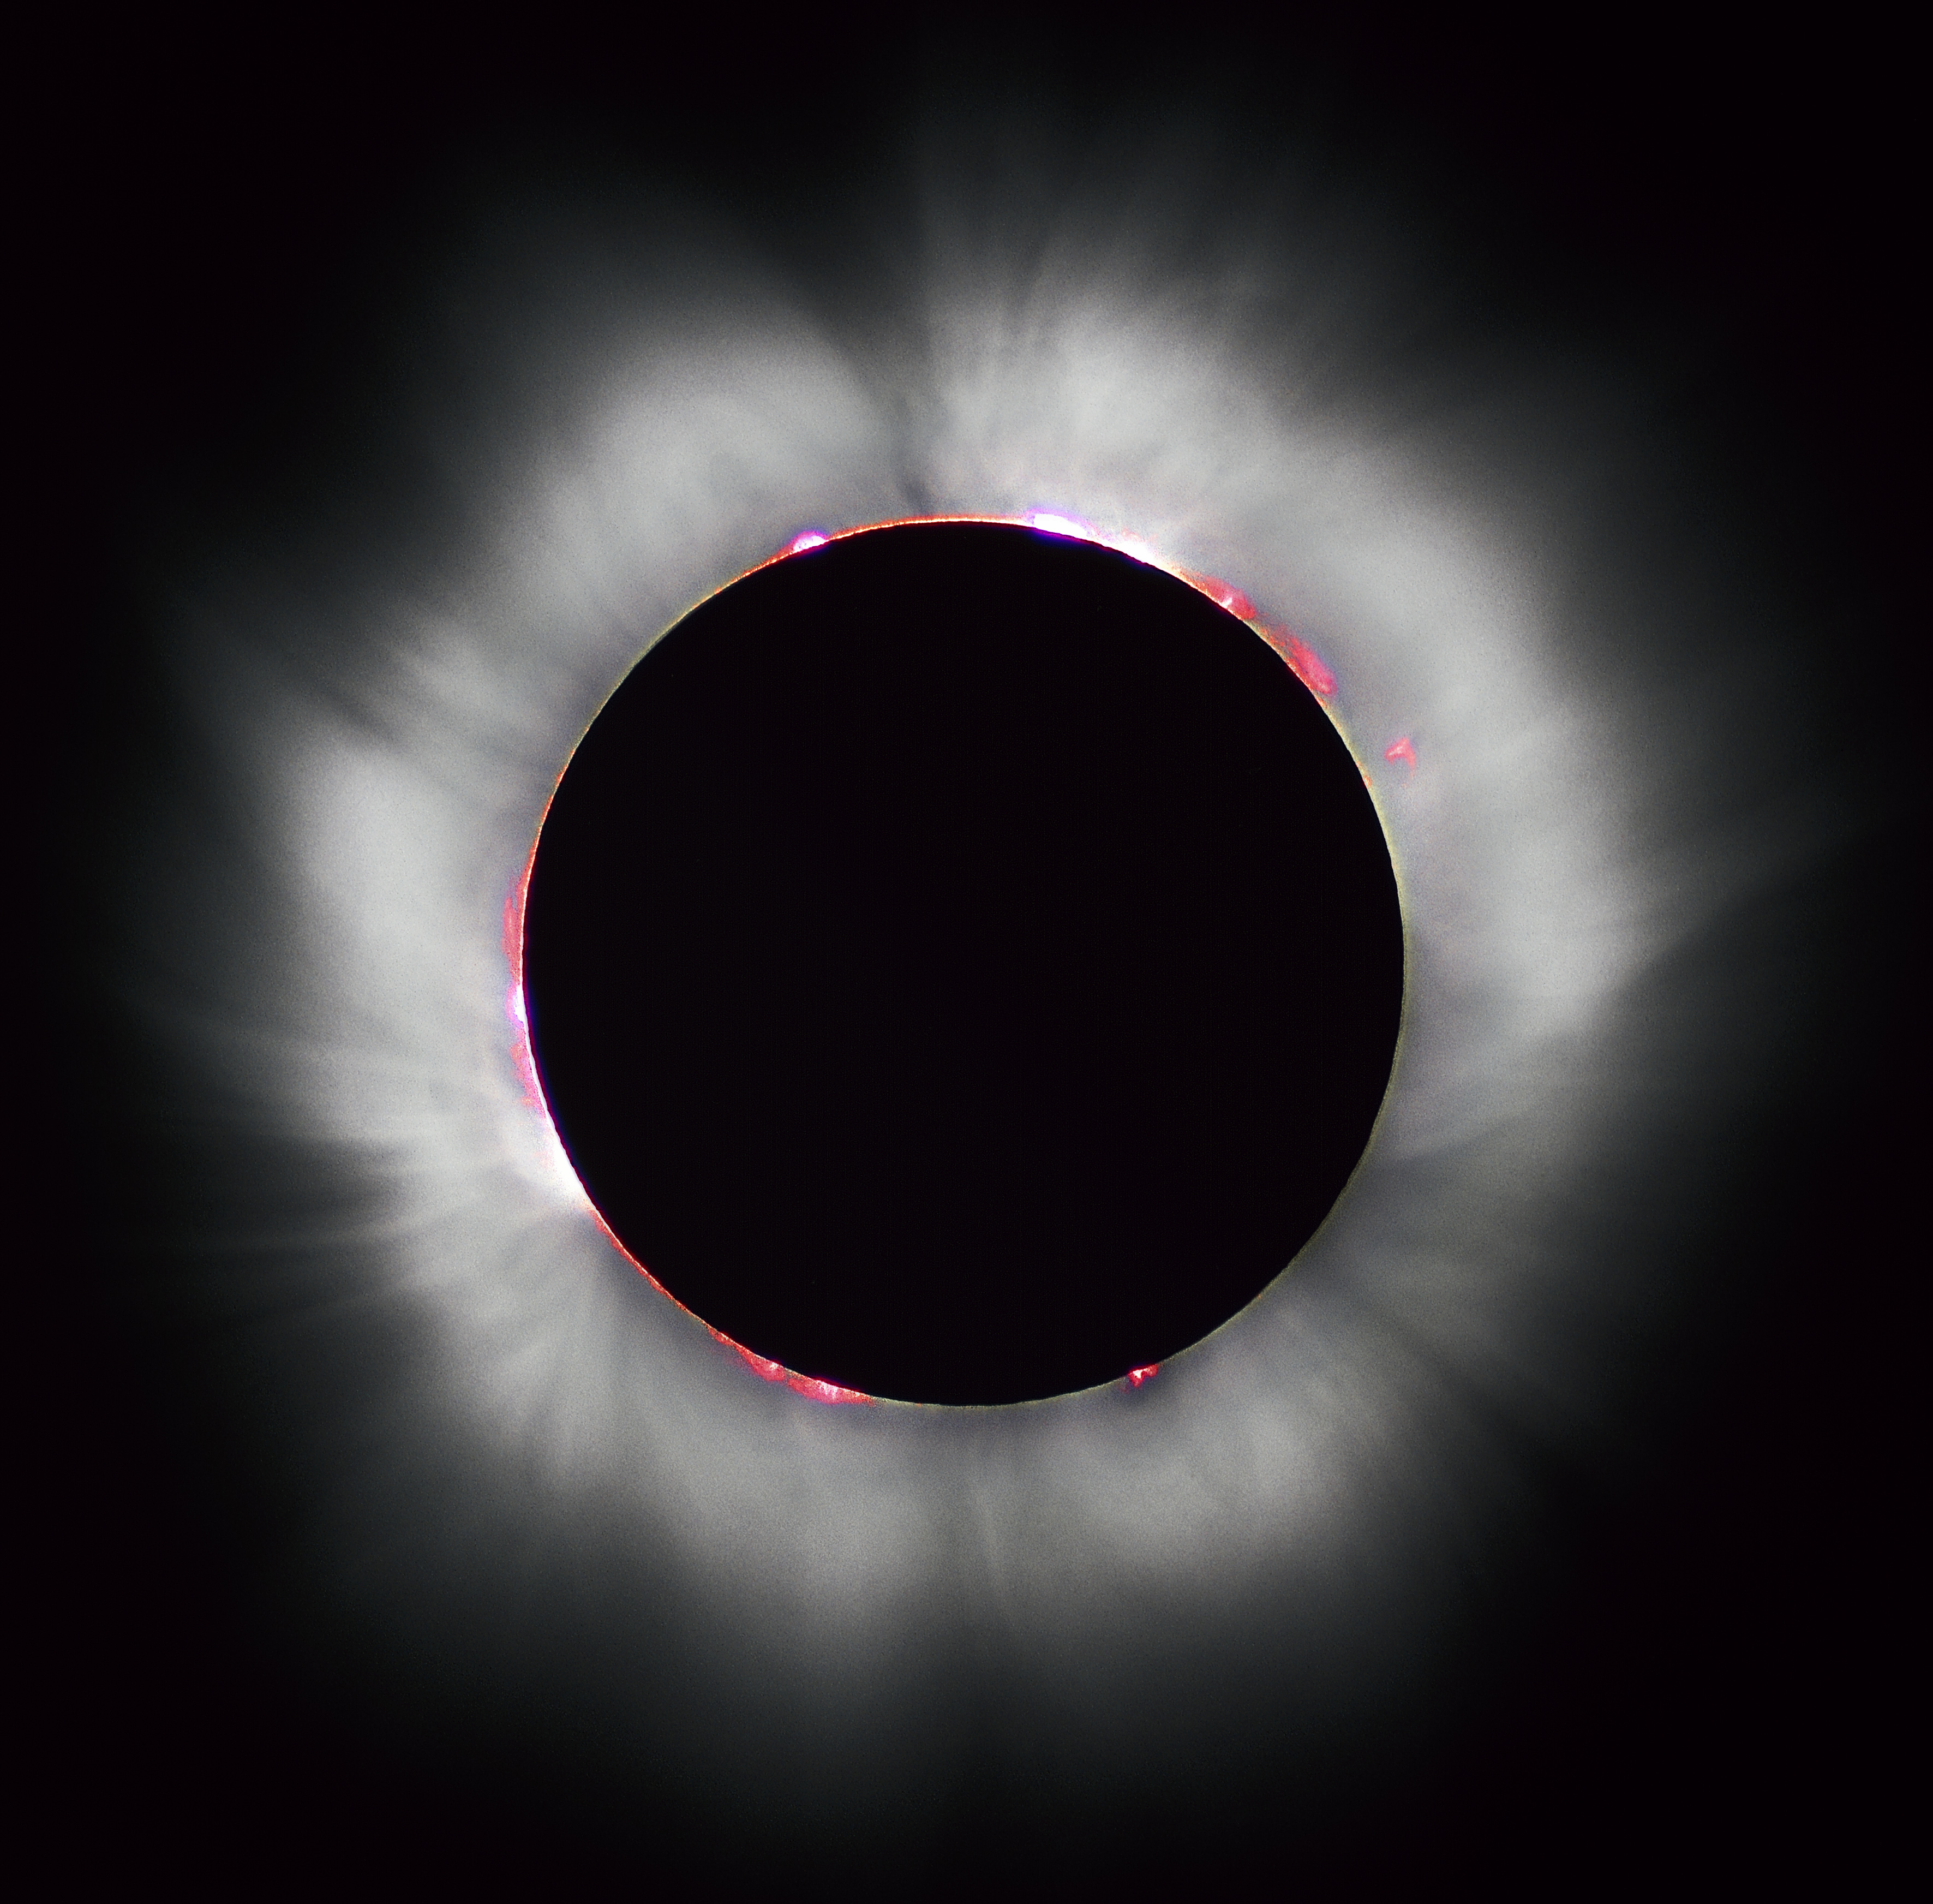
A corona ( coronas or coronae) is the outermost layer of a star's atmosphere. It consists of plasma. The Sun's corona lies above the chromosphere and extends millions of kilometres into outer space. It is most easily seen during a total solar eclipse, but it is also observable with a coronagraph. Spectroscopic measurements indicate strong ionization in the corona and a plasma temperature in excess of , much hotter than the surface of the Sun, known as the photosphere. The word ''corona'' is , in turn derived . History In 1724, French-Italian astronomer Giacomo F. Maraldi recognized that the aura visible during a solar eclipse belongs to the Sun, not to the Moon. In 1809, Spanish astronomer José Joaquín de Ferrer coined the term 'corona'. Based in his own observations of the 1806 solar eclipse at Kinderhook (New York), de Ferrer also proposed that the corona was part of the Sun and not of the Moon. English astronomer Norman Lockyer identified the first element unknown o ... [...More Info...] [...Related Items...] OR: [Wikipedia] [Google] [Baidu] |
Electromagnetic Spectrum
The electromagnetic spectrum is the range of frequencies (the spectrum) of electromagnetic radiation and their respective wavelengths and photon energies. The electromagnetic spectrum covers electromagnetic waves with frequencies ranging from below one hertz to above 1025 hertz, corresponding to wavelengths from thousands of kilometers down to a fraction of the size of an atomic nucleus. This frequency range is divided into separate bands, and the electromagnetic waves within each frequency band are called by different names; beginning at the low frequency (long wavelength) end of the spectrum these are: radio waves, microwaves, infrared, visible light, ultraviolet, X-rays, and gamma rays at the high-frequency (short wavelength) end. The electromagnetic waves in each of these bands have different characteristics, such as how they are produced, how they interact with matter, and their practical applications. There is no known limit for long and short wavelengths. Extreme ultr ... [...More Info...] [...Related Items...] OR: [Wikipedia] [Google] [Baidu] |
Ultraviolet
Ultraviolet (UV) is a form of electromagnetic radiation with wavelength from 10 nanometer, nm (with a corresponding frequency around 30 Hertz, PHz) to 400 nm (750 Hertz, THz), shorter than that of visible light, but longer than X-rays. UV radiation is present in sunlight, and constitutes about 10% of the total electromagnetic radiation output from the Sun. It is also produced by electric arcs and specialized lights, such as mercury-vapor lamps, tanning lamps, and black lights. Although long-wavelength ultraviolet is not considered an ionizing radiation because its photons lack the energy to ionization, ionize atoms, it can cause chemical reactions and causes many substances to glow or fluorescence, fluoresce. Consequently, the chemical and biological effects of UV are greater than simple heating effects, and many practical applications of UV radiation derive from its interactions with organic molecules. Short-wave ultraviolet light damages DNA and sterilizes surf ... [...More Info...] [...Related Items...] OR: [Wikipedia] [Google] [Baidu] |
Photoionization
Photoionization is the physical process in which an ion is formed from the interaction of a photon with an atom or molecule. Cross section Not every interaction between a photon and an atom, or molecule, will result in photoionization. The probability of photoionization is related to the photoionization cross section of the species -- the probability of an ionization event conceptualized as a hypothetical cross-sectional area. This cross section depends on the energy of the photon (proportional to its wavenumber) and the species being considered i.e. it depends on the structure of the molecular species. In the case of molecules, the photoionization cross-section can be estimated by examination of Franck-Condon factors between a ground-state molecule and the target ion. This can be initialized by computing the vibrations of a molecule and associated cation (post ionization) using quantum chemical software e.g. QChem. For photon energies below the ionization threshold, the photoion ... [...More Info...] [...Related Items...] OR: [Wikipedia] [Google] [Baidu] |
Spectrogram
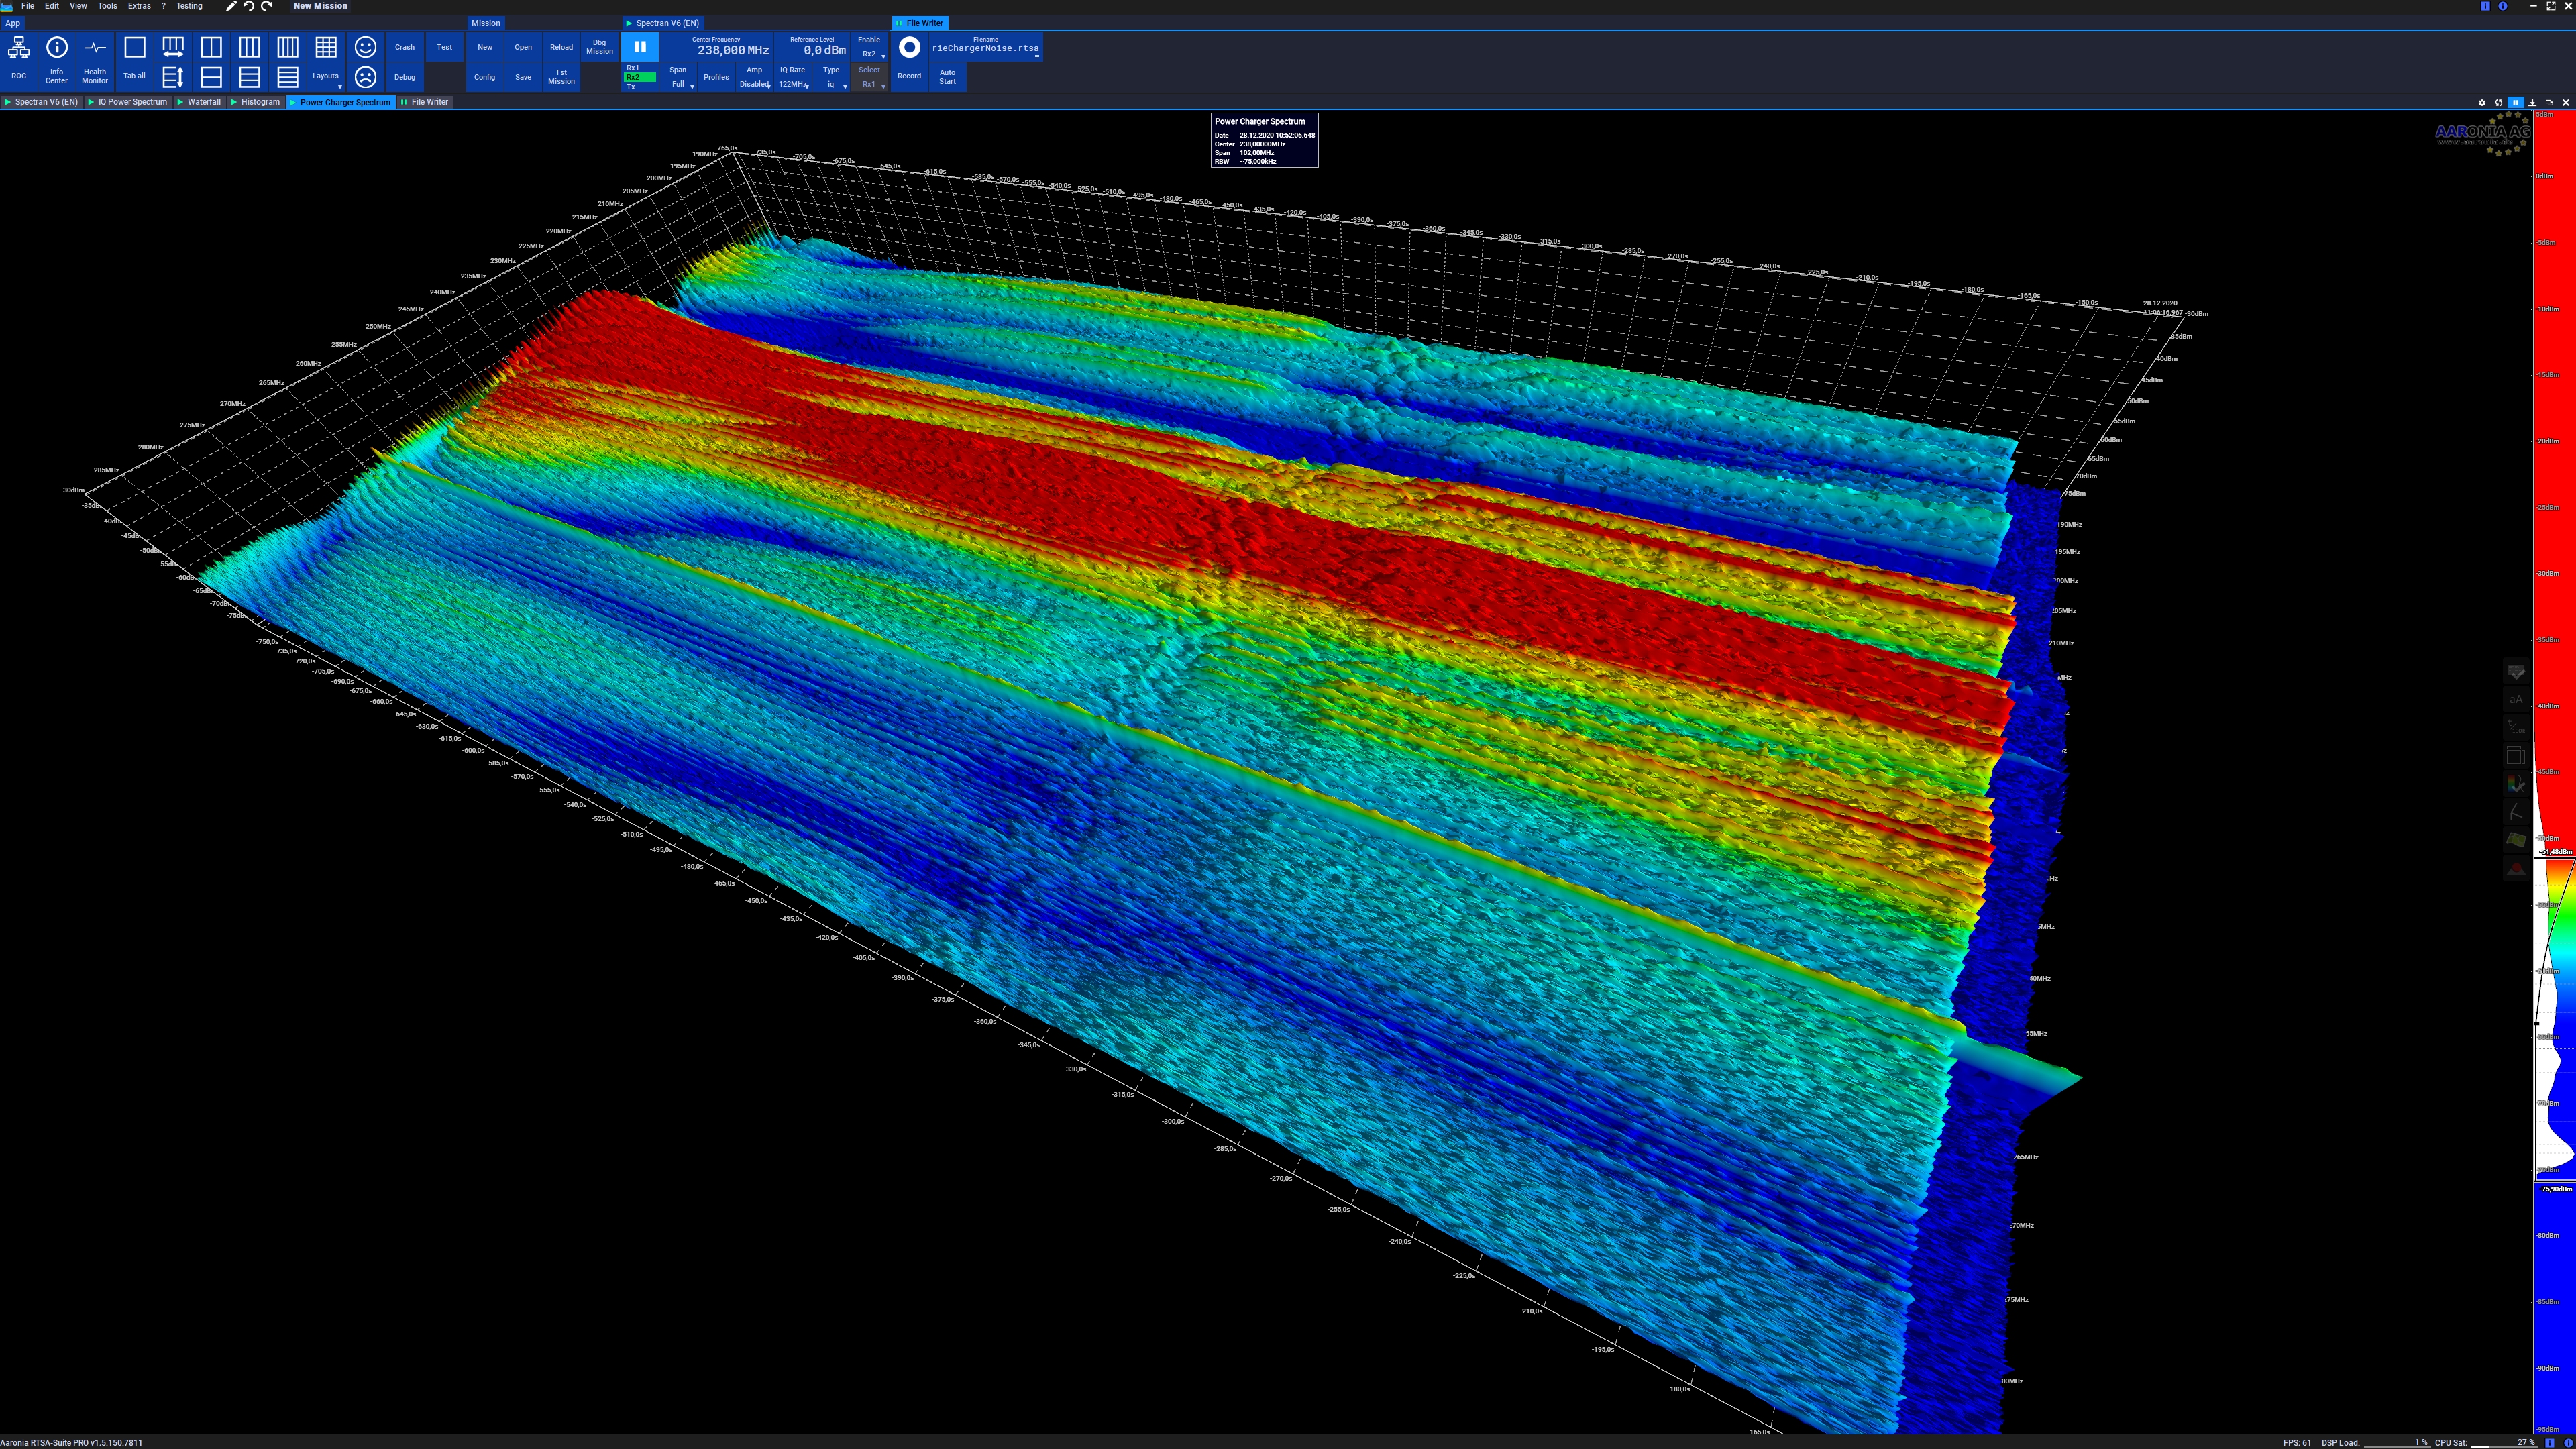
A spectrogram is a visual representation of the spectrum of frequencies of a signal as it varies with time. When applied to an audio signal, spectrograms are sometimes called sonographs, voiceprints, or voicegrams. When the data are represented in a 3D plot they may be called ''waterfall displays''. Spectrograms are used extensively in the fields of music, linguistics, sonar, radar, speech processing, seismology, and others. Spectrograms of audio can be used to identify spoken words phonetically, and to analyse the various calls of animals. A spectrogram can be generated by an optical spectrometer, a bank of band-pass filters, by Fourier transform or by a wavelet transform (in which case it is also known as a scaleogram or scalogram). A spectrogram is usually depicted as a heat map, i.e., as an image with the intensity shown by varying the colour or brightness. Format A common format is a graph with two geometric dimensions: one axis represents time, and the other axis r ... [...More Info...] [...Related Items...] OR: [Wikipedia] [Google] [Baidu] |
Radio Astronomy
Radio astronomy is a subfield of astronomy that studies celestial objects at radio frequencies. The first detection of radio waves from an astronomical object was in 1933, when Karl Jansky at Bell Telephone Laboratories reported radiation coming from the Milky Way. Subsequent observations have identified a number of different sources of radio emission. These include stars and galaxies, as well as entirely new classes of objects, such as radio galaxies, quasars, pulsars, and masers. The discovery of the cosmic microwave background radiation, regarded as evidence for the Big Bang theory, was made through radio astronomy. Radio astronomy is conducted using large radio antennas referred to as radio telescopes, that are either used singularly, or with multiple linked telescopes utilizing the techniques of radio interferometry and aperture synthesis. The use of interferometry allows radio astronomy to achieve high angular resolution, as the resolving power of an interferometer is set ... [...More Info...] [...Related Items...] OR: [Wikipedia] [Google] [Baidu] |
Radio Telescope
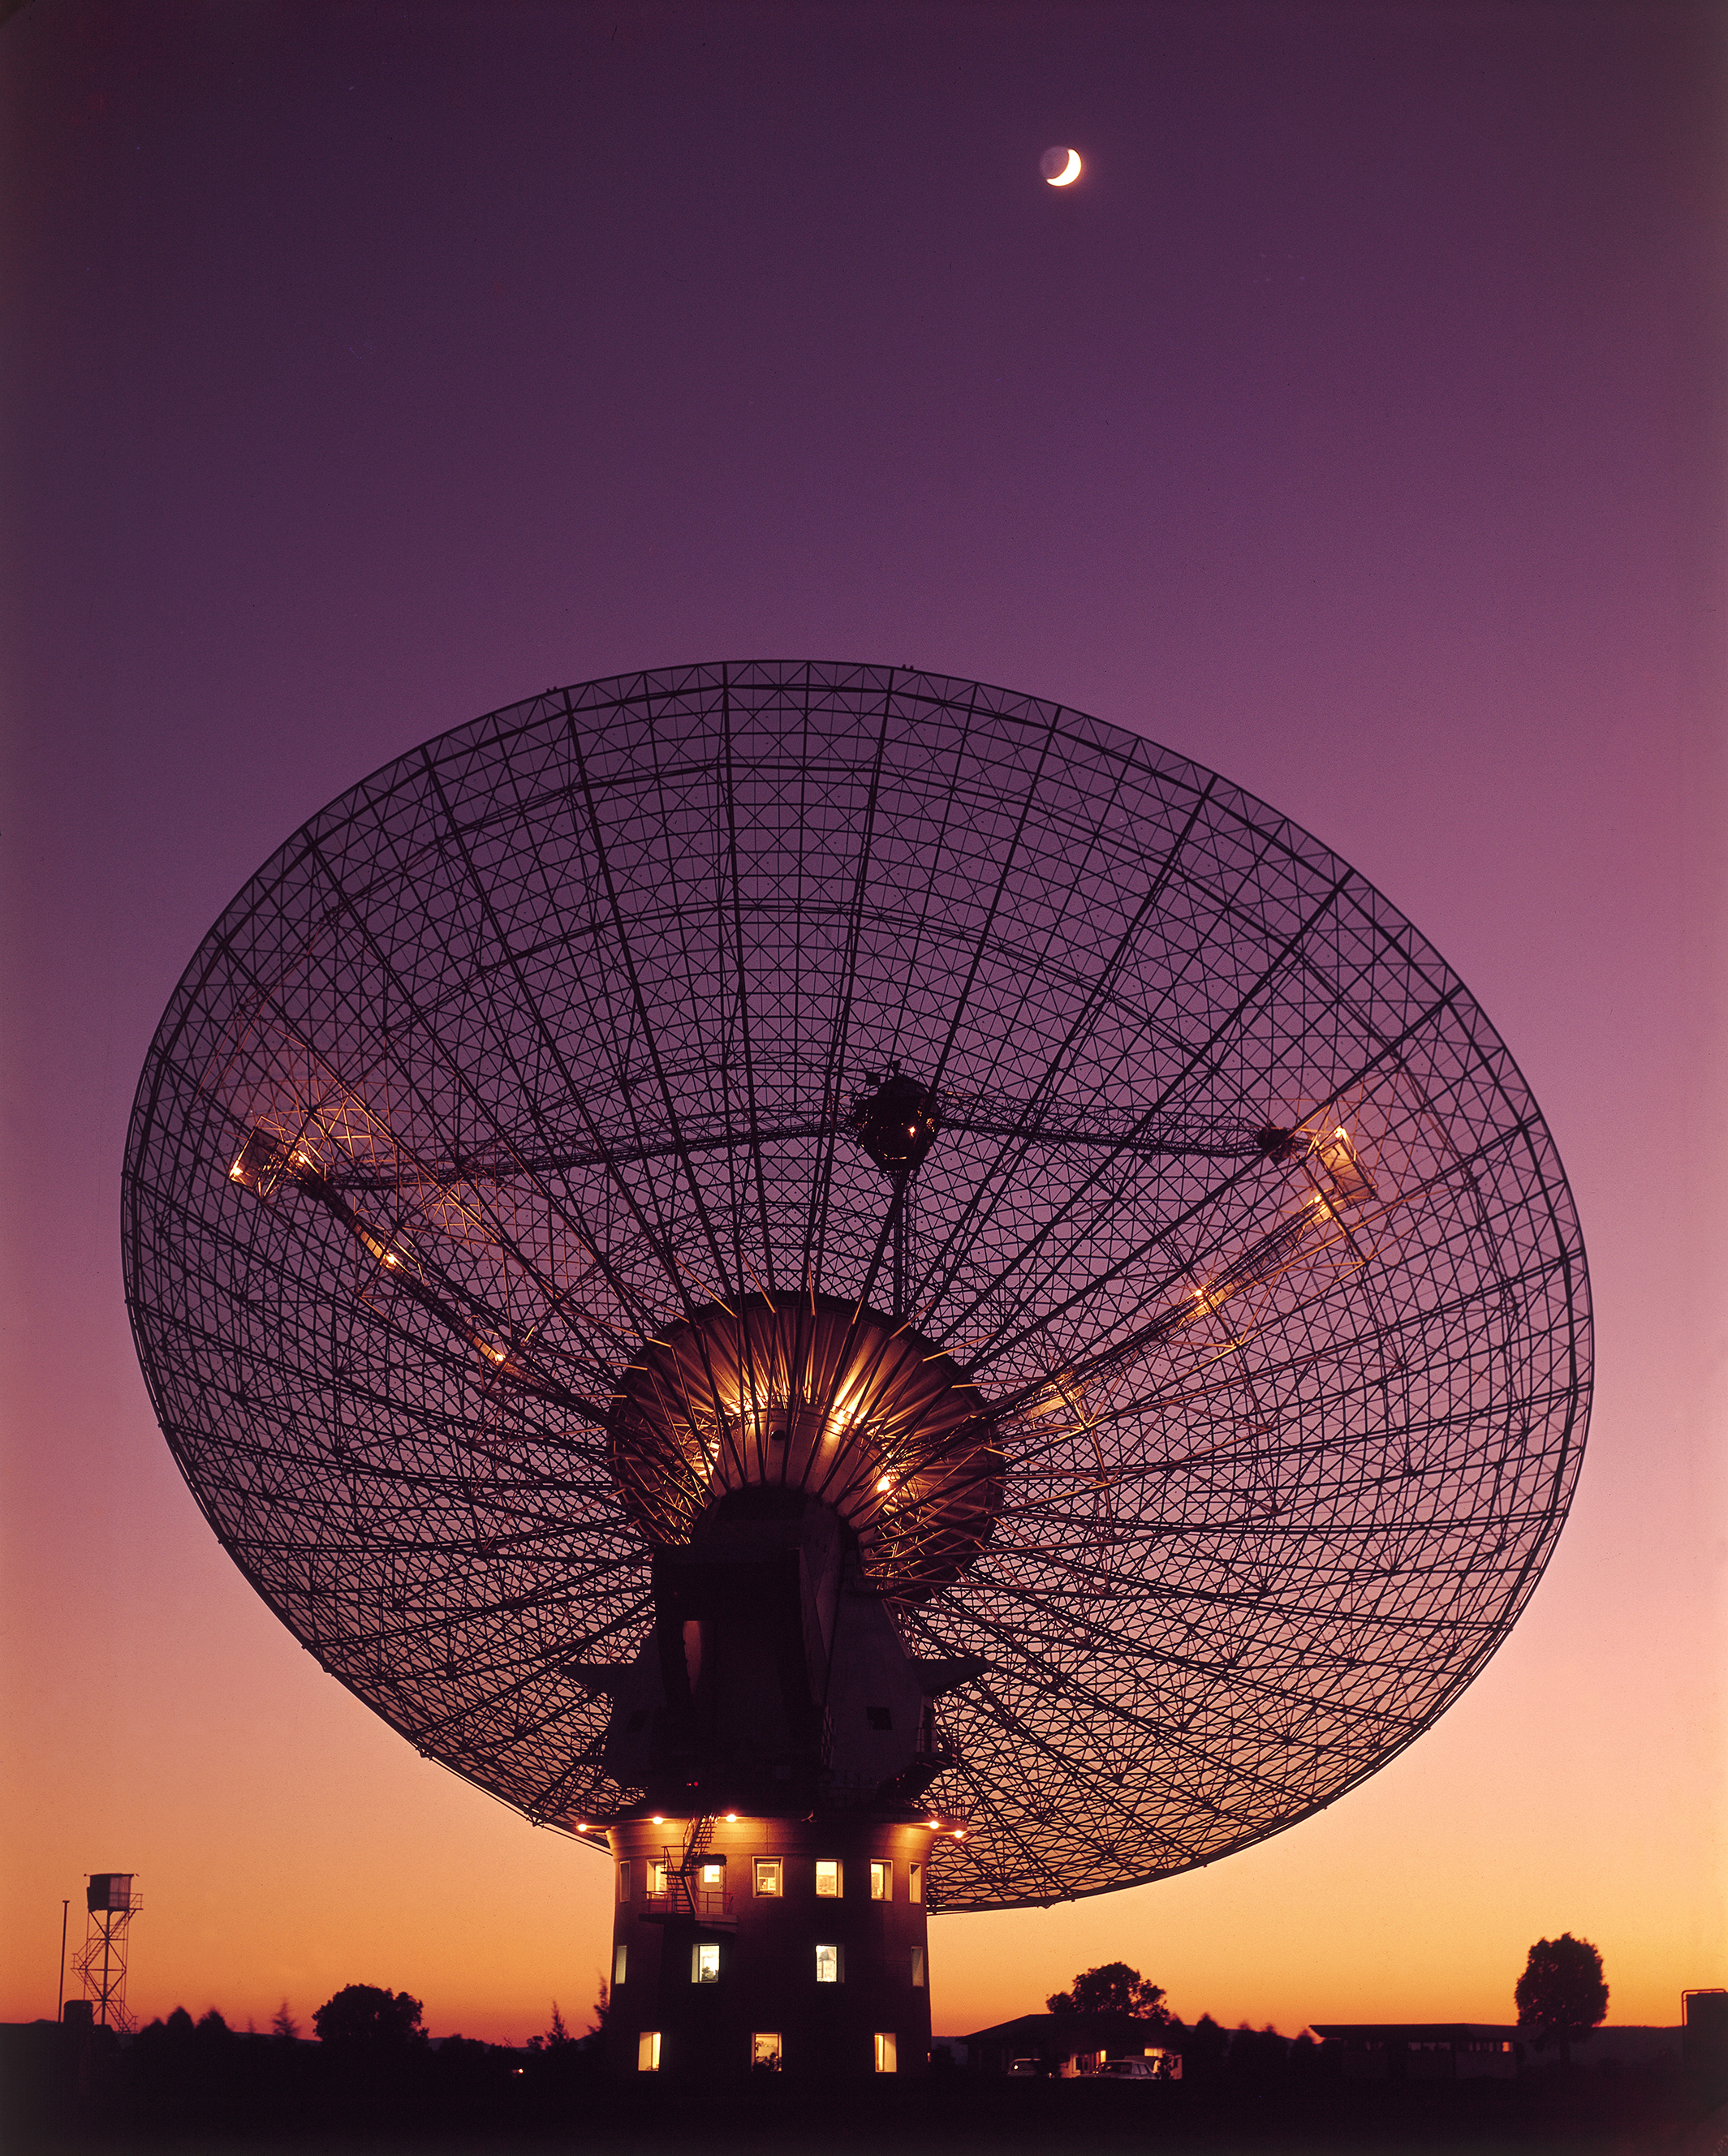
A radio telescope is a specialized antenna and radio receiver used to detect radio waves from astronomical radio sources in the sky. Radio telescopes are the main observing instrument used in radio astronomy, which studies the radio frequency portion of the electromagnetic spectrum emitted by astronomical objects, just as optical telescopes are the main observing instrument used in traditional optical astronomy which studies the light wave portion of the spectrum coming from astronomical objects. Unlike optical telescopes, radio telescopes can be used in the daytime as well as at night. Since astronomical radio sources such as planets, stars, nebulas and galaxies are very far away, the radio waves coming from them are extremely weak, so radio telescopes require very large antennas to collect enough radio energy to study them, and extremely sensitive receiving equipment. Radio telescopes are typically large parabolic ("dish") antennas similar to those employed in tracking an ... [...More Info...] [...Related Items...] OR: [Wikipedia] [Google] [Baidu] |
Galactic Nuclei
An active galactic nucleus (AGN) is a compact region at the center of a galaxy that has a much-higher-than-normal luminosity over at least some portion of the electromagnetic spectrum with characteristics indicating that the luminosity is not produced by stars. Such excess non-stellar emission has been observed in the radio, microwave, infrared, optical, ultra-violet, X-ray and gamma ray wavebands. A galaxy hosting an AGN is called an "active galaxy". The non-stellar radiation from an AGN is theorized to result from the accretion of matter by a supermassive black hole at the center of its host galaxy. Active galactic nuclei are the most luminous persistent sources of electromagnetic radiation in the universe, and as such can be used as a means of discovering distant objects; their evolution as a function of cosmic time also puts constraints on models of the cosmos. The observed characteristics of an AGN depend on several properties such as the mass of the central black hole, ... [...More Info...] [...Related Items...] OR: [Wikipedia] [Google] [Baidu] |
Emission Line
A spectral line is a dark or bright line in an otherwise uniform and continuous spectrum, resulting from emission or absorption of light in a narrow frequency range, compared with the nearby frequencies. Spectral lines are often used to identify atoms and molecules. These "fingerprints" can be compared to the previously collected ones of atoms and molecules, and are thus used to identify the atomic and molecular components of stars and planets, which would otherwise be impossible. Types of line spectra Spectral lines are the result of interaction between a quantum system (usually atoms, but sometimes molecules or atomic nucleus, atomic nuclei) and a single photon. When a photon has about the right amount of photon energy, energy (which is connected to its frequency) to allow a change in the energy state of the system (in the case of an atom this is usually an electron changing Electron configuration, orbitals), the photon is absorbed. Then the energy will be spontaneously ... [...More Info...] [...Related Items...] OR: [Wikipedia] [Google] [Baidu] |


