|
Mahalanobis Distance
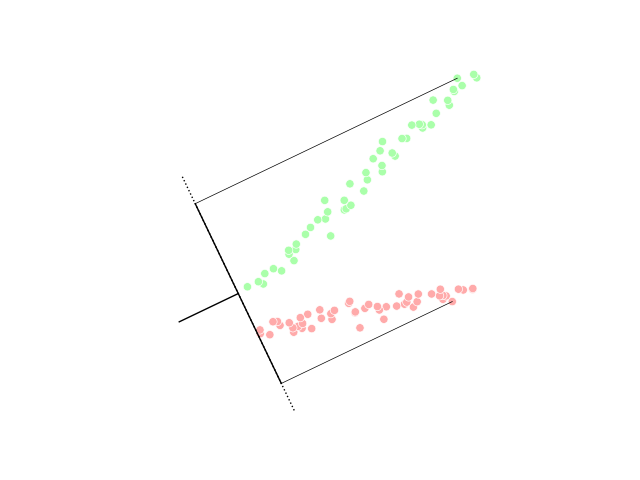
The Mahalanobis distance is a measure of the distance between a point ''P'' and a distribution ''D'', introduced by P. C. Mahalanobis in 1936. Mahalanobis's definition was prompted by the problem of identifying the similarities of skulls based on measurements in 1927. It is a multi-dimensional generalization of the idea of measuring how many standard deviations away ''P'' is from the mean of ''D''. This distance is zero for ''P'' at the mean of ''D'' and grows as ''P'' moves away from the mean along each principal component axis. If each of these axes is re-scaled to have unit variance, then the Mahalanobis distance corresponds to standard Euclidean distance in the transformed space. The Mahalanobis distance is thus unitless, scale-invariant, and takes into account the correlations of the data set. Definition Given a probability distribution Q on \R^N, with mean \vec = (\mu_1, \mu_2, \mu_3, \dots , \mu_N)^\mathsf and positive-definite covariance matrix S, the Mahalanobis dis ... [...More Info...] [...Related Items...] OR: [Wikipedia] [Google] [Baidu] |
Probability Distribution
In probability theory and statistics, a probability distribution is the mathematical function that gives the probabilities of occurrence of different possible outcomes for an experiment. It is a mathematical description of a random phenomenon in terms of its sample space and the probabilities of events (subsets of the sample space). For instance, if is used to denote the outcome of a coin toss ("the experiment"), then the probability distribution of would take the value 0.5 (1 in 2 or 1/2) for , and 0.5 for (assuming that the coin is fair). Examples of random phenomena include the weather conditions at some future date, the height of a randomly selected person, the fraction of male students in a school, the results of a survey to be conducted, etc. Introduction A probability distribution is a mathematical description of the probabilities of events, subsets of the sample space. The sample space, often denoted by \Omega, is the set of all possible outcomes of a random phe ... [...More Info...] [...Related Items...] OR: [Wikipedia] [Google] [Baidu] |
Centroid
In mathematics and physics, the centroid, also known as geometric center or center of figure, of a plane figure or solid figure is the arithmetic mean position of all the points in the surface of the figure. The same definition extends to any object in ''n''-dimensional Euclidean space. In geometry, one often assumes uniform mass density, in which case the ''barycenter'' or ''center of mass'' coincides with the centroid. Informally, it can be understood as the point at which a cutout of the shape (with uniformly distributed mass) could be perfectly balanced on the tip of a pin. In physics, if variations in gravity are considered, then a ''center of gravity'' can be defined as the weighted mean of all points weighted by their specific weight. In geography, the centroid of a radial projection of a region of the Earth's surface to sea level is the region's geographical center. History The term "centroid" is of recent coinage (1814). It is used as a substitute for the older te ... [...More Info...] [...Related Items...] OR: [Wikipedia] [Google] [Baidu] |
Supervised Classification
Supervised learning (SL) is a machine learning paradigm for problems where the available data consists of labelled examples, meaning that each data point contains features (covariates) and an associated label. The goal of supervised learning algorithms is learning a function that maps feature vectors (inputs) to labels (output), based on example input-output pairs. It infers a function from ' consisting of a set of ''training examples''. In supervised learning, each example is a ''pair'' consisting of an input object (typically a vector) and a desired output value (also called the ''supervisory signal''). A supervised learning algorithm analyzes the training data and produces an inferred function, which can be used for mapping new examples. An optimal scenario will allow for the algorithm to correctly determine the class labels for unseen instances. This requires the learning algorithm to generalize from the training data to unseen situations in a "reasonable" way (see inductive b ... [...More Info...] [...Related Items...] OR: [Wikipedia] [Google] [Baidu] |
Linear Discriminant Analysis
Linear discriminant analysis (LDA), normal discriminant analysis (NDA), or discriminant function analysis is a generalization of Fisher's linear discriminant, a method used in statistics and other fields, to find a linear combination of features that characterizes or separates two or more classes of objects or events. The resulting combination may be used as a linear classifier, or, more commonly, for dimensionality reduction before later classification. LDA is closely related to analysis of variance (ANOVA) and regression analysis, which also attempt to express one dependent variable as a linear combination of other features or measurements. However, ANOVA uses categorical independent variables and a continuous dependent variable, whereas discriminant analysis has continuous independent variables and a categorical dependent variable (''i.e.'' the class label). Logistic regression and probit regression are more similar to LDA than ANOVA is, as they also explain a categorical var ... [...More Info...] [...Related Items...] OR: [Wikipedia] [Google] [Baidu] |
Hotelling's T-square Distribution
In statistics, particularly in hypothesis testing, the Hotelling's ''T''-squared distribution (''T''2), proposed by Harold Hotelling, is a multivariate probability distribution that is tightly related to the ''F''-distribution and is most notable for arising as the distribution of a set of sample statistics that are natural generalizations of the statistics underlying the Student's ''t''-distribution. The Hotelling's ''t''-squared statistic (''t''2) is a generalization of Student's ''t''-statistic that is used in multivariate hypothesis testing. Motivation The distribution arises in multivariate statistics in undertaking tests of the differences between the (multivariate) means of different populations, where tests for univariate problems would make use of a ''t''-test. The distribution is named for Harold Hotelling, who developed it as a generalization of Student's ''t''-distribution. Definition If the vector d is Gaussian multivariate-distributed with zero mean and unit ... [...More Info...] [...Related Items...] OR: [Wikipedia] [Google] [Baidu] |
Statistical Classification
In statistics, classification is the problem of identifying which of a set of categories (sub-populations) an observation (or observations) belongs to. Examples are assigning a given email to the "spam" or "non-spam" class, and assigning a diagnosis to a given patient based on observed characteristics of the patient (sex, blood pressure, presence or absence of certain symptoms, etc.). Often, the individual observations are analyzed into a set of quantifiable properties, known variously as explanatory variables or ''features''. These properties may variously be categorical (e.g. "A", "B", "AB" or "O", for blood type), ordinal (e.g. "large", "medium" or "small"), integer-valued (e.g. the number of occurrences of a particular word in an email) or real-valued (e.g. a measurement of blood pressure). Other classifiers work by comparing observations to previous observations by means of a similarity or distance function. An algorithm that implements classification, especially in a ... [...More Info...] [...Related Items...] OR: [Wikipedia] [Google] [Baidu] |
Data Clustering
Cluster analysis or clustering is the task of grouping a set of objects in such a way that objects in the same group (called a cluster) are more similar (in some sense) to each other than to those in other groups (clusters). It is a main task of exploratory data analysis, and a common technique for statistical data analysis, used in many fields, including pattern recognition, image analysis, information retrieval, bioinformatics, data compression, computer graphics and machine learning. Cluster analysis itself is not one specific algorithm, but the general task to be solved. It can be achieved by various algorithms that differ significantly in their understanding of what constitutes a cluster and how to efficiently find them. Popular notions of clusters include groups with small distances between cluster members, dense areas of the data space, intervals or particular statistical distributions. Clustering can therefore be formulated as a multi-objective optimization problem. The ... [...More Info...] [...Related Items...] OR: [Wikipedia] [Google] [Baidu] |
Leverage (statistics)
In statistics and in particular in regression analysis, leverage is a measure of how far away the independent variable values of an observation are from those of the other observations. ''High-leverage points'', if any, are outliers with respect to the independent variables. That is, high-leverage points have no neighboring points in \mathbb^ space, where '''' is the number of independent variables in a regression model. This makes the fitted model likely to pass close to a high leverage observation. Hence high-leverage points have the potential to cause large changes in the parameter estimates when they are deleted i.e., to be influential points. Although an influential point will typically have high leverage, a high leverage point is not necessarily an influential point. The leverage is typically defined as the diagonal elements of the hat matrix. Definition and interpretations Consider the linear regression model _i = \boldsymbol_i^\boldsymbol+_i, i=1,\, 2,\ldots,\, n. That is ... [...More Info...] [...Related Items...] OR: [Wikipedia] [Google] [Baidu] |
Gaussian
Carl Friedrich Gauss (1777–1855) is the eponym of all of the topics listed below. There are over 100 topics all named after this German mathematician and scientist, all in the fields of mathematics, physics, and astronomy. The English eponymous adjective ''Gaussian'' is pronounced . Mathematics Algebra and linear algebra Geometry and differential geometry Number theory Cyclotomic fields *Gaussian period *Gaussian rational *Gauss sum, an exponential sum over Dirichlet characters ** Elliptic Gauss sum, an analog of a Gauss sum **Quadratic Gauss sum Analysis, numerical analysis, vector calculus and calculus of variations Complex analysis and convex analysis *Gauss–Lucas theorem *Gauss's continued fraction, an analytic continued fraction derived from the hypergeometric functions * Gauss's criterion – described oEncyclopedia of Mathematics* Gauss's hypergeometric theorem, an identity on hypergeometric series *Gauss plane Statistics *Gauss–Kuzmi ... [...More Info...] [...Related Items...] OR: [Wikipedia] [Google] [Baidu] |
Log-likelihood
The likelihood function (often simply called the likelihood) represents the probability of random variable realizations conditional on particular values of the statistical parameters. Thus, when evaluated on a given sample, the likelihood function indicates which parameter values are more ''likely'' than others, in the sense that they would have made the observed data more probable. Consequently, the likelihood is often written as \mathcal(\theta\mid X) instead of P(X \mid \theta), to emphasize that it is to be understood as a function of the parameters \theta instead of the random variable X. In maximum likelihood estimation, the arg max of the likelihood function serves as a point estimate for \theta, while local curvature (approximated by the likelihood's Hessian matrix) indicates the estimate's precision. Meanwhile in Bayesian statistics, parameter estimates are derived from the converse of the likelihood, the so-called posterior probability, which is calculated via Bayes' ru ... [...More Info...] [...Related Items...] OR: [Wikipedia] [Google] [Baidu] |
Concave Function
In mathematics, a concave function is the negative of a convex function. A concave function is also synonymously called concave downwards, concave down, convex upwards, convex cap, or upper convex. Definition A real-valued function f on an interval (or, more generally, a convex set in vector space) is said to be ''concave'' if, for any x and y in the interval and for any \alpha \in ,1/math>, :f((1-\alpha )x+\alpha y)\geq (1-\alpha ) f(x)+\alpha f(y) A function is called ''strictly concave'' if :f((1-\alpha )x + \alpha y) > (1-\alpha) f(x) + \alpha f(y)\, for any \alpha \in (0,1) and x \neq y. For a function f: \mathbb \to \mathbb, this second definition merely states that for every z strictly between x and y, the point (z, f(z)) on the graph of f is above the straight line joining the points (x, f(x)) and (y, f(y)). A function f is quasiconcave if the upper contour sets of the function S(a)=\ are convex sets. Properties Functions of a single variable # A differentiab ... [...More Info...] [...Related Items...] OR: [Wikipedia] [Google] [Baidu] |


