|
Generalized Spectrogram
In order to view a signal (taken to be a function of time) represented over both time and frequency axis, time–frequency representation is used. Spectrogram is one of the most popular time-frequency representation, and generalized spectrogram, also called "two-window spectrogram", is the generalized application of spectrogram. Definition The definition of the spectrogram relies on the Gabor transform (also called short-time Fourier transform, for short STFT), whose idea is to localize a signal in time by multiplying it with translations of a window function w(t). The definition of spectrogram is :S(t,f) = (t,f)G_^*(t,f)=, (t,f), ^2, where denotes the Gabor Transform of x(t). Based on the spectrogram, the generalized spectrogram is defined as: :S(t,f) = (t,f)G_^*(t,f), where: :\left( \right) = \int_^\infty :\left( \right) = \int_^\infty For w_1(t) = w_2(t)=w(t), it reduces to the classical spectrogram: :S(t,f) = (t,f)G_^*(t,f)=, (t,f), ^2 The feature of Generalized spec ... [...More Info...] [...Related Items...] OR: [Wikipedia] [Google] [Baidu] |
Time–frequency Representation
A time–frequency representation (TFR) is a view of a signal (taken to be a function of time) represented over both time and frequency. Time–frequency analysis means analysis into the time–frequency domain provided by a TFR. This is achieved by using a formulation often called "Time–Frequency Distribution", abbreviated as TFD. TFRs are often complex-valued fields over time and frequency, where the modulus of the field represents either amplitude or "energy density" (the concentration of the root mean square over time and frequency), and the argument of the field represents phase. Background and motivation A signal, as a function of time, may be considered as a representation with perfect ''time resolution''. In contrast, the magnitude of the Fourier transform (FT) of the signal may be considered as a representation with perfect ''spectral resolution'' but with no time information because the magnitude of the FT conveys frequency content but it fails to convey when, in ti ... [...More Info...] [...Related Items...] OR: [Wikipedia] [Google] [Baidu] |
Spectrogram
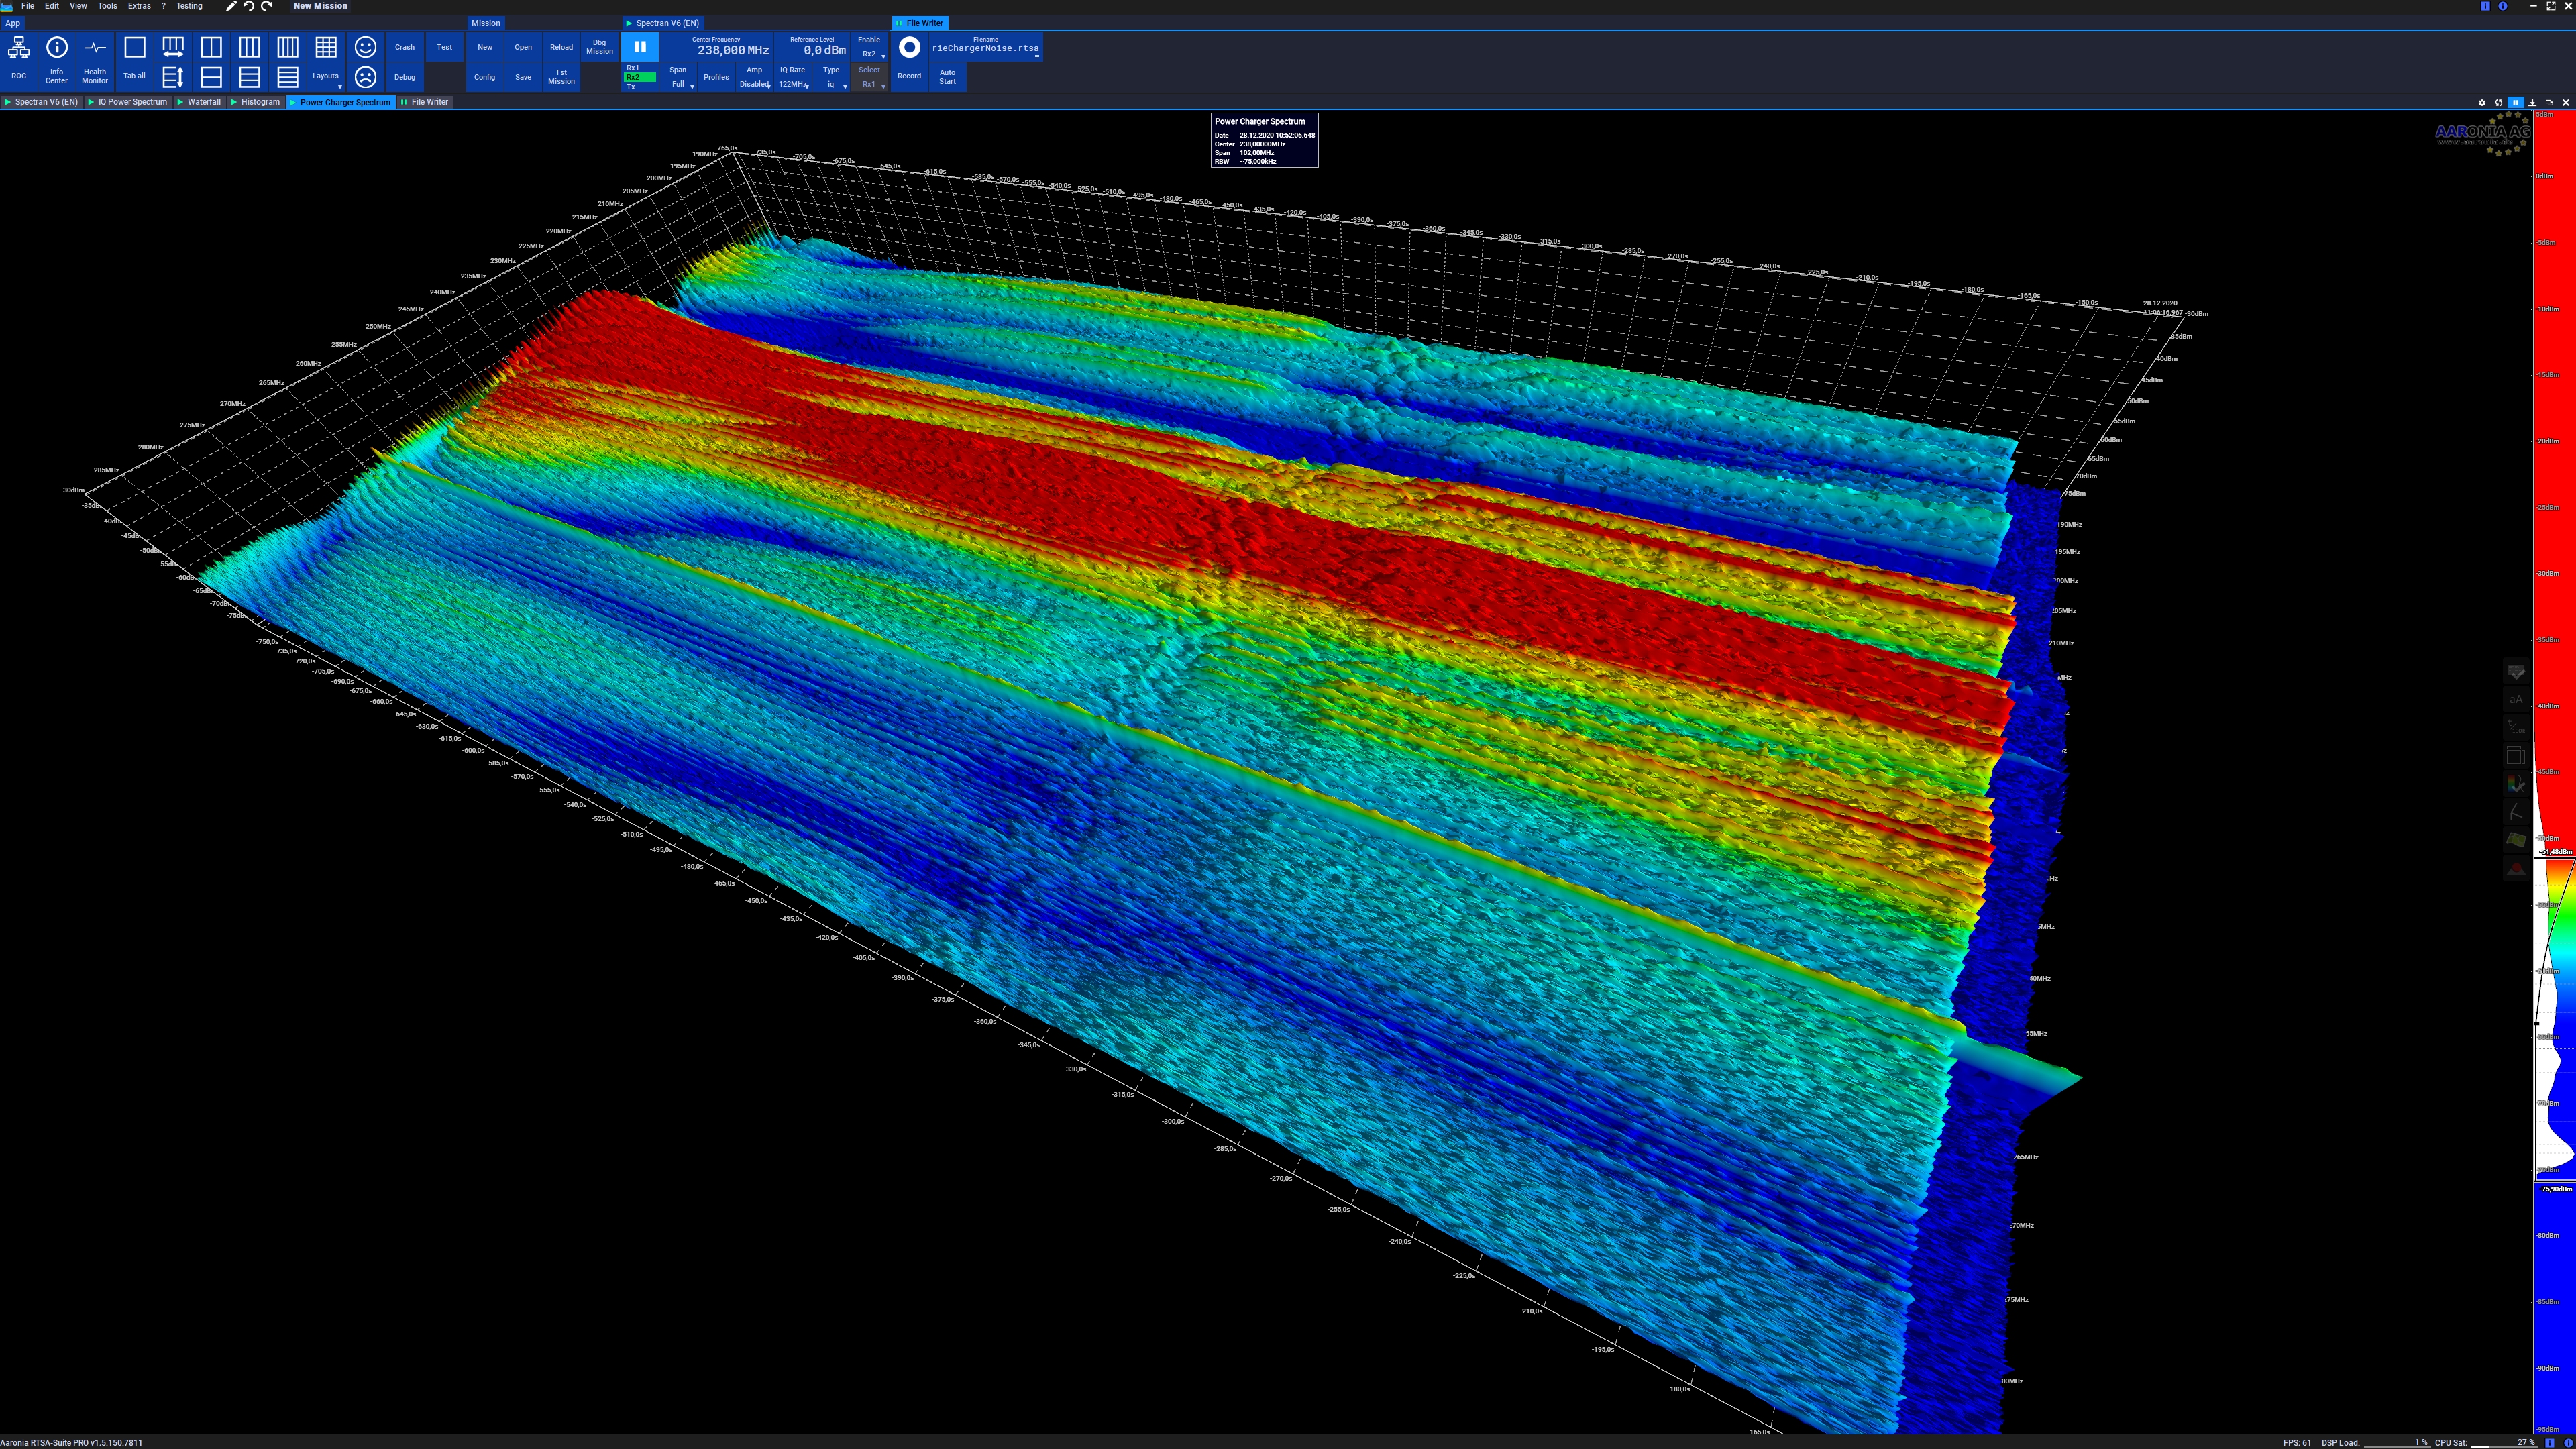
A spectrogram is a visual representation of the spectrum of frequencies of a signal as it varies with time. When applied to an audio signal, spectrograms are sometimes called sonographs, voiceprints, or voicegrams. When the data are represented in a 3D plot they may be called '' waterfall displays''. Spectrograms are used extensively in the fields of music, linguistics, sonar, radar, speech processing, seismology, and others. Spectrograms of audio can be used to identify spoken words phonetically, and to analyse the various calls of animals. A spectrogram can be generated by an optical spectrometer, a bank of band-pass filters, by Fourier transform or by a wavelet transform (in which case it is also known as a scaleogram or scalogram). A spectrogram is usually depicted as a heat map, i.e., as an image with the intensity shown by varying the colour or brightness. Format A common format is a graph with two geometric dimensions: one axis represents time, and the other a ... [...More Info...] [...Related Items...] OR: [Wikipedia] [Google] [Baidu] |
Gabor Transform
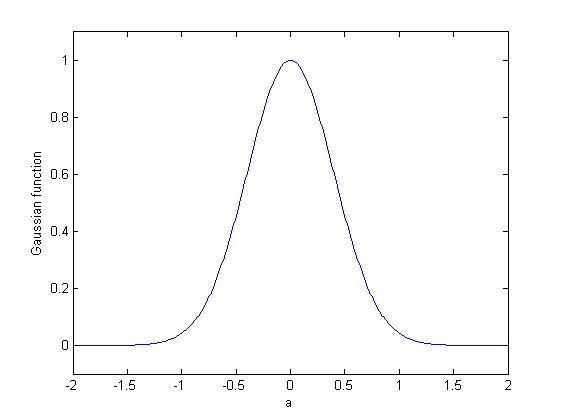
The Gabor transform, named after Dennis Gabor, is a special case of the short-time Fourier transform. It is used to determine the sinusoidal frequency and phase content of local sections of a signal as it changes over time. The function to be transformed is first multiplied by a Gaussian function, which can be regarded as a window function, and the resulting function is then transformed with a Fourier transform to derive the time-frequency analysis.E. Sejdić, I. Djurović, J. Jiang, “Time-frequency feature representation using energy concentration: An overview of recent advances,” ''Digital Signal Processing'', vol. 19, no. 1, pp. 153-183, January 2009. The window function means that the signal near the time being analyzed will have higher weight. The Gabor transform of a signal ''x''(''t'') is defined by this formula: : G_x(\tau,\omega) = \int_^\infty x(t)e^e^\,dt The Gaussian function has infinite range and it is impractical for implementation. However, a level of signi ... [...More Info...] [...Related Items...] OR: [Wikipedia] [Google] [Baidu] |
Wigner Distribution Function
The Wigner distribution function (WDF) is used in signal processing as a transform in time-frequency analysis. The WDF was first proposed in physics to account for quantum corrections to classical statistical mechanics in 1932 by Eugene Wigner, and it is of importance in quantum mechanics in phase space (see, by way of comparison: ''Wigner quasi-probability distribution'', also called the ''Wigner function'' or the ''Wigner–Ville distribution''). Given the shared algebraic structure between position-momentum and time-frequency conjugate pairs, it also usefully serves in signal processing, as a transform in time-frequency analysis, the subject of this article. Compared to a short-time Fourier transform, such as the Gabor transform, the Wigner distribution function provides the highest possible temporal vs frequency resolution which is mathematically possible within the limitations of the uncertainty principle. The downside is the introduction of large cross terms between every ... [...More Info...] [...Related Items...] OR: [Wikipedia] [Google] [Baidu] |
Dirac Delta Function
In mathematics, the Dirac delta distribution ( distribution), also known as the unit impulse, is a generalized function or distribution over the real numbers, whose value is zero everywhere except at zero, and whose integral over the entire real line is equal to one. The current understanding of the unit impulse is as a linear functional that maps every continuous function (e.g., f(x)) to its value at zero of its domain (f(0)), or as the weak limit of a sequence of bump functions (e.g., \delta(x) = \lim_ \frace^), which are zero over most of the real line, with a tall spike at the origin. Bump functions are thus sometimes called "approximate" or "nascent" delta distributions. The delta function was introduced by physicist Paul Dirac as a tool for the normalization of state vectors. It also has uses in probability theory and signal processing. Its validity was disputed until Laurent Schwartz developed the theory of distributions where it is defined as a linear form acting o ... [...More Info...] [...Related Items...] OR: [Wikipedia] [Google] [Baidu] |


