|
DataScene
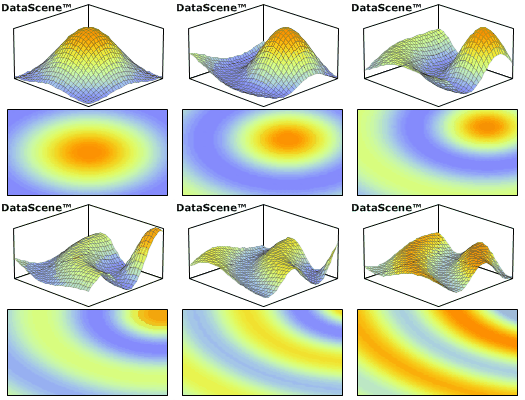
DataScene is a scientific graphing, animation, data analysis, and real-time data monitoring software package. It was developed with the Common Language Infrastructure technology and the GDI+ graphics library. With the two Common Language Runtime engines - the .Net and Mono frameworks - DataScene runs on all major operating systems. With DataScene, the user can plot 39 types 2D & 3D graphs (e.g., Area graph, Bar graph, Boxplot graph, Pie graph, Line graph, Histogram graph, Surface graph, Polar graph, Water Fall graph, etc.), manipulate, print, and export graphs to various formats (e.g., Bitmap, WMF/EMF, JPEG, PNG, GIF, TIFF, PostScript, and PDF), analyze data with different mathematical methods ( fitting curves, calculating statics, FFT, etc.), create chart animations for presentations (e.g. with PowerPoint), classes, and web pages, and monitor and chart real-time data. History DataScene was first released (version 1.0) in March 2009 for the Windows platform and the .Net 2 ... [...More Info...] [...Related Items...] OR: [Wikipedia] [Google] [Baidu] |
Area Graph
An area chart or area graph displays graphically quantitative data. It is based on the line chart. The area between axis and line are commonly emphasized with colors, textures and hatchings. Commonly one compares two or more quantities with an area chart. History William Playfair is usually credited with inventing the area charts as well as the line, bar, and pie charts. His book ''The Commercial and Political Atlas'', published in 1786, contained a number of time-series In mathematics, a time series is a series of data points indexed (or listed or graphed) in time order. Most commonly, a time series is a sequence taken at successive equally spaced points in time. Thus it is a sequence of discrete-time data. Exa ... graphs, including ''Interest of the National Debt from the Revolution'' and ''Chart of all the Imports and Exports to and from England from the Year 1700 to 1782'' that are often described as the first area charts in history. Common uses Area charts are used ... [...More Info...] [...Related Items...] OR: [Wikipedia] [Google] [Baidu] |
Curve Fitting
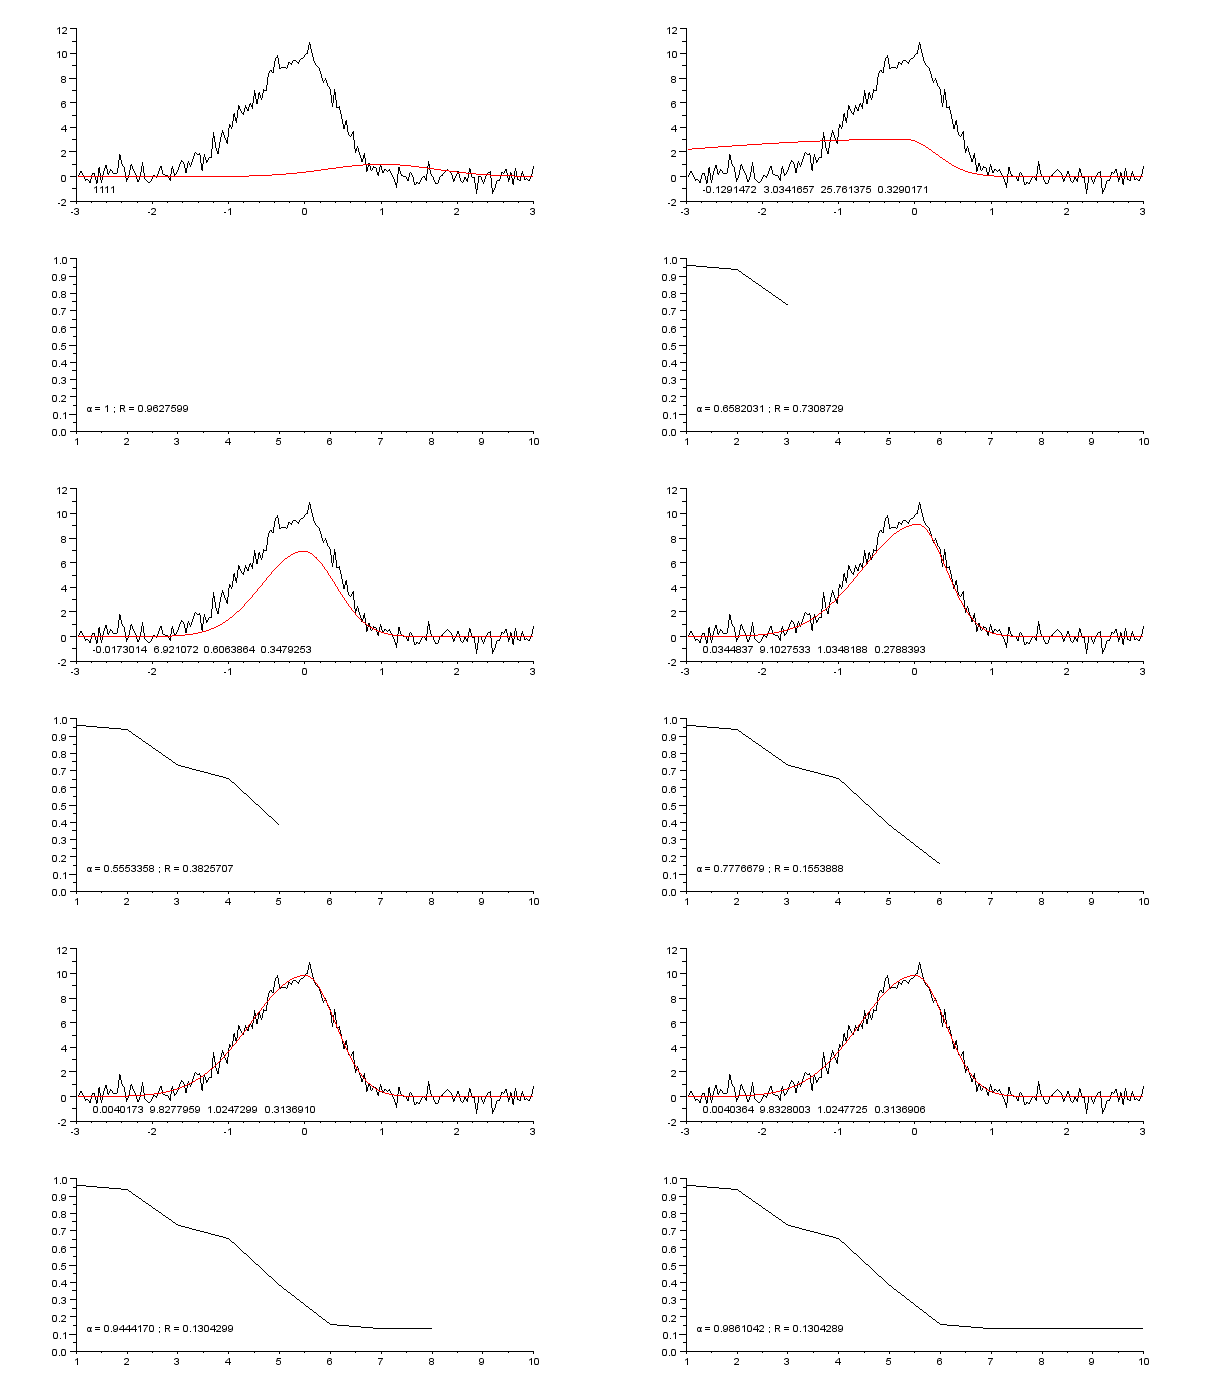
Curve fitting is the process of constructing a curve, or mathematical function, that has the best fit to a series of data points, possibly subject to constraints. Curve fitting can involve either interpolation, where an exact fit to the data is required, or smoothing, in which a "smooth" function is constructed that approximately fits the data. A related topic is regression analysis, which focuses more on questions of statistical inference such as how much uncertainty is present in a curve that is fit to data observed with random errors. Fitted curves can be used as an aid for data visualization, to infer values of a function where no data are available, and to summarize the relationships among two or more variables. Extrapolation refers to the use of a fitted curve beyond the range of the observed data, and is subject to a degree of uncertainty since it may reflect the method used to construct the curve as much as it reflects the observed data. For linear-algebraic analysis o ... [...More Info...] [...Related Items...] OR: [Wikipedia] [Google] [Baidu] |
PostScript
PostScript (PS) is a page description language in the electronic publishing and desktop publishing realm. It is a dynamically typed, concatenative programming language. It was created at Adobe Systems by John Warnock, Charles Geschke, Doug Brotz, Ed Taft and Bill Paxton from 1982 to 1984. History The concepts of the PostScript language were seeded in 1976 by John Gaffney at Evans & Sutherland, a computer graphics company. At that time Gaffney and John Warnock were developing an interpreter for a large three-dimensional graphics database of New York Harbor. Concurrently, researchers at Xerox PARC had developed the first laser printer and had recognized the need for a standard means of defining page images. In 1975-76 Bob Sproull and William Newman developed the Press format, which was eventually used in the Xerox Star system to drive laser printers. But Press, a data format rather than a language, lacked flexibility, and PARC mounted the Interpress effort to create a succ ... [...More Info...] [...Related Items...] OR: [Wikipedia] [Google] [Baidu] |
TIFF
Tag Image File Format, abbreviated TIFF or TIF, is an image file format for storing raster graphics images, popular among graphic artists, the publishing industry, and photographers. TIFF is widely supported by scanning, faxing, word processing, optical character recognition, image manipulation, desktop publishing, and page-layout applications. The format was created by the Aldus Corporation for use in desktop publishing. It published the latest version 6.0 in 1992, subsequently updated with an Adobe Systems copyright after the latter acquired Aldus in 1994. Several Aldus or Adobe technical notes have been published with minor extensions to the format, and several specifications have been based on TIFF 6.0, including TIFF/EP (ISO 12234-2), TIFF/IT (ISO 12639), TIFF-F (RFC 2306) and TIFF-FX (RFC 3949). History TIFF was created as an attempt to get desktop scanner vendors of the mid-1980s to agree on a common scanned image file format, in place of a multitude of proprietary for ... [...More Info...] [...Related Items...] OR: [Wikipedia] [Google] [Baidu] |
Portable Network Graphics
Portable Network Graphics (PNG, officially pronounced , colloquially pronounced ) is a raster-graphics file format that supports lossless data compression. PNG was developed as an improved, non-patented replacement for Graphics Interchange Format (GIF) — unofficially, the initials PNG stood for the recursive acronym "PNG's not GIF". PNG supports palette-based images (with palettes of 24-bit RGB or 32-bit RGBA colors), grayscale images (with or without an alpha channel for transparency), and full-color non-palette-based RGB or RGBA images. The PNG working group designed the format for transferring images on the Internet, not for professional-quality print graphics; therefore non-RGB color spaces such as CMYK are not supported. A PNG file contains a single image in an extensible structure of ''chunks'', encoding the basic pixels and other information such as textual comments and integrity checks documented in RFC 2083. PNG files use the file extension PNG or png and hav ... [...More Info...] [...Related Items...] OR: [Wikipedia] [Google] [Baidu] |
JPEG
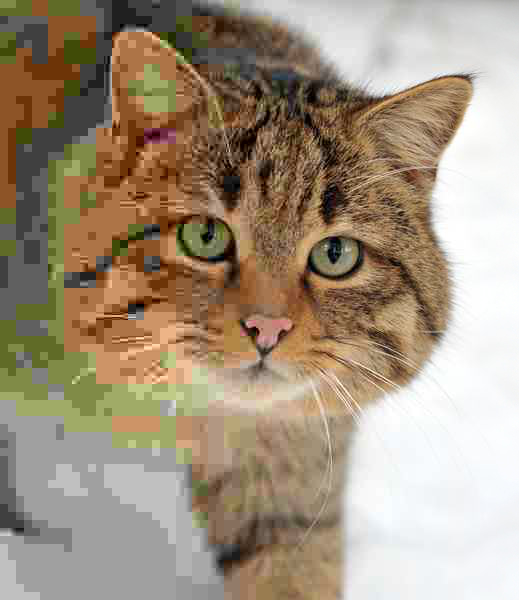
JPEG ( ) is a commonly used method of lossy compression for digital images, particularly for those images produced by digital photography. The degree of compression can be adjusted, allowing a selectable tradeoff between storage size and image quality. JPEG typically achieves 10:1 compression with little perceptible loss in image quality. Since its introduction in 1992, JPEG has been the most widely used image compression standard in the world, and the most widely used digital image format, with several billion JPEG images produced every day as of 2015. The term "JPEG" is an acronym for the Joint Photographic Experts Group, which created the standard in 1992. JPEG was largely responsible for the proliferation of digital images and digital photos across the Internet, and later social media. JPEG compression is used in a number of image file formats. JPEG/Exif is the most common image format used by digital cameras and other photographic image capture devices; along with JPEG ... [...More Info...] [...Related Items...] OR: [Wikipedia] [Google] [Baidu] |
Windows Metafile
Windows Metafile (WMF) is an image file format originally designed for Microsoft Windows in the 1990s. The original Windows Metafile format was not device-independent (though could be made more so with placement headers) and may contain both vector graphics and bitmap components. It acts in a similar manner to SVG files. WMF files were later superseded by Enhanced Metafiles (EMF files) which did provide for device-independence. EMF files were then themselves enhanced via EMF+ files. Essentially, a metafile stores a list of records consisting of drawing commands, property definitions and graphics objects to display an image on screen. The drawing commands used are closely related to the commands of the Graphics Device Interface (GDI) API used for drawing in Microsoft Windows. There are three major types of metafiles – a WMF is a 16-bit format introduced in Windows 3.0. It is the native vector format for Microsoft Office applications such as Word, PowerPoint, and Publisher. revi ... [...More Info...] [...Related Items...] OR: [Wikipedia] [Google] [Baidu] |
BMP File Format
The BMP file format, also known as bitmap image file, device independent bitmap (DIB) file format and bitmap, is a raster graphics image file format used to store bitmap digital images, independently of the display device (such as a graphics adapter), especially on Microsoft Windows and OS/2 operating systems. The BMP file format is capable of storing two-dimensional digital images both monochrome and color, in various color depths, and optionally with data compression, alpha channels, and color profiles. The Windows Metafile (WMF) specification covers the BMP file format. Device-independent bitmaps and the BMP file format Microsoft has defined a particular representation of color bitmaps of different color depths, as an aid to exchanging bitmaps between devices and applications with a variety of internal representations. They called these device-independent bitmaps or DIBs, and the file format for them is called DIB file format or BMP image file format. According to Microso ... [...More Info...] [...Related Items...] OR: [Wikipedia] [Google] [Baidu] |
Polar Graph
In mathematics, the polar coordinate system is a two-dimensional coordinate system in which each point on a plane is determined by a distance from a reference point and an angle from a reference direction. The reference point (analogous to the origin of a Cartesian coordinate system) is called the ''pole'', and the ray from the pole in the reference direction is the ''polar axis''. The distance from the pole is called the ''radial coordinate'', ''radial distance'' or simply ''radius'', and the angle is called the ''angular coordinate'', ''polar angle'', or ''azimuth''. Angles in polar notation are generally expressed in either degrees or radians (2 rad being equal to 360°). Grégoire de Saint-Vincent and Bonaventura Cavalieri independently introduced the concepts in the mid-17th century, though the actual term "polar coordinates" has been attributed to Gregorio Fontana in the 18th century. The initial motivation for the introduction of the polar system was the study of circular ... [...More Info...] [...Related Items...] OR: [Wikipedia] [Google] [Baidu] |
Surface (mathematics)
In mathematics, a surface is a mathematical model of the common concept of a surface. It is a generalization of a plane, but, unlike a plane, it may be curved; this is analogous to a curve generalizing a straight line. There are several more precise definitions, depending on the context and the mathematical tools that are used for the study. The simplest mathematical surfaces are planes and spheres in the Euclidean 3-space. The exact definition of a surface may depend on the context. Typically, in algebraic geometry, a surface may cross itself (and may have other singularities), while, in topology and differential geometry, it may not. A surface is a topological space of dimension two; this means that a moving point on a surface may move in two directions (it has two degrees of freedom). In other words, around almost every point, there is a ''coordinate patch'' on which a two-dimensional coordinate system is defined. For example, the surface of the Earth resembles (ideally) a ... [...More Info...] [...Related Items...] OR: [Wikipedia] [Google] [Baidu] |
Histogram
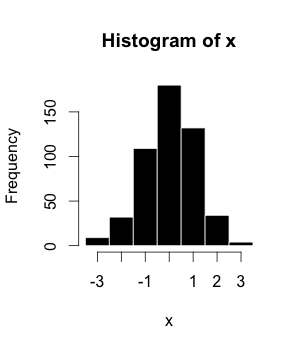
A histogram is an approximate representation of the distribution of numerical data. The term was first introduced by Karl Pearson. To construct a histogram, the first step is to " bin" (or "bucket") the range of values—that is, divide the entire range of values into a series of intervals—and then count how many values fall into each interval. The bins are usually specified as consecutive, non-overlapping intervals of a variable. The bins (intervals) must be adjacent and are often (but not required to be) of equal size. If the bins are of equal size, a bar is drawn over the bin with height proportional to the frequency—the number of cases in each bin. A histogram may also be normalized to display "relative" frequencies showing the proportion of cases that fall into each of several categories, with the sum of the heights equaling 1. However, bins need not be of equal width; in that case, the erected rectangle is defined to have its ''area'' proportional to the frequency ... [...More Info...] [...Related Items...] OR: [Wikipedia] [Google] [Baidu] |


