|
Chord Diagram (other) , a circularly-ordered set with a one-to-one pairing, often drawn as chords of a circle
{{dab ...
A chord diagram may refer to: * Chord diagram (music), a diagram showing the fingering of a chord on a guitar or other fretted musical instrument *Chord diagram (information visualization), a diagram showing a many-to-many relationship between objects as curved arcs within a circle *Chord diagram (mathematics) In mathematics, a chord diagram consists of a cyclic order on a set of objects, together with a one-to-one pairing (perfect matching) of those objects. Chord diagrams are conventionally visualized by arranging the objects in their order around a ... [...More Info...] [...Related Items...] OR: [Wikipedia] [Google] [Baidu] |
Chord Diagram (music)
In music, a chord diagram (also called a fretboard diagram or fingering diagram) is a diagram indicating the fingering of a chord on fretted string instruments, showing a schematic view of the fretboard with markings for the frets that should be pressed when playing the chord. Instruments that commonly use this notation include the guitar, banjo, lute, and mandolin. See also *Tablature Tablature (or tabulature, or tab for short) is a form of musical notation indicating instrument fingering rather than musical pitches. Tablature is common for fretted stringed instruments such as the guitar, lute or vihuela, as well as many fr ..., a related notation for the sequence of chords in a piece of music References Guitar chords Musical notation {{music-theory-stub ... [...More Info...] [...Related Items...] OR: [Wikipedia] [Google] [Baidu] |
Chord Diagram (information Visualization)
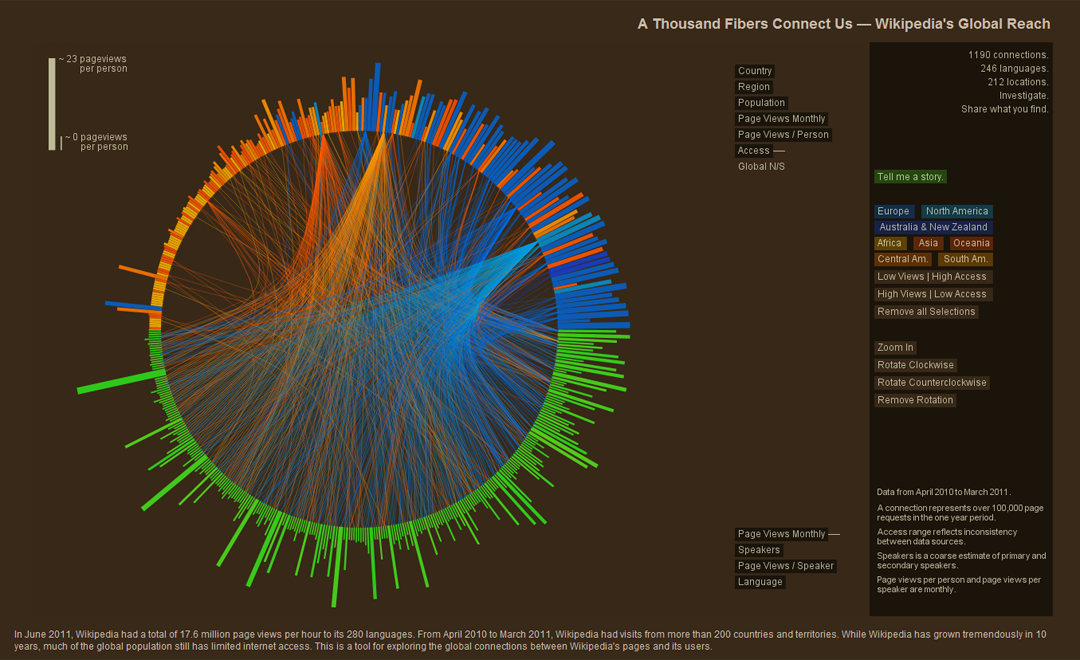
A chord diagram is a graphical method of displaying the inter-relationships between data in a matrix. The data are arranged radially around a circle with the relationships between the data points typically drawn as arcs connecting the data. The format can be aesthetically pleasing, making it a popular choice in the world of data visualization. The primary use of chord diagrams is to show the flows or connections between several entities (called nodes). Each entity is represented by a fragment (often colored or pattered) along the circumference of the circle. Arcs are drawn between entities to show flows (and exchanges in economics). The thickness of the arc is proportional to the significance of the flow. Name Chord diagrams get their name from terminology used in geometry. A chord of a circle is a geometric line segment whose endpoints both lie on the circle. Chord diagrams are also known as radial network diagrams and may sometimes be referred to as a type of circular layo ... [...More Info...] [...Related Items...] OR: [Wikipedia] [Google] [Baidu] |
